Tamadoge Price Prediction – October 15
Exchange activities that have featured buyers and sellers of Tamadoge versus the US Dollar show that the crypto-economic price swings high from the crucial trading spot of $0.008000, averaging resistance of $0.009000.
Looking at how bulls and bears have been positioned in the market over the medium to long term based on either medium term or short term has shown that uprising moments are likely to experience a reversal around the resistance point of $0.00900 or some other higher spots below the point of $0.01500 at the best potential over the long term. In opposition to these assertions, investors should continue to use the buy-and-hold strategy even after reaching the higher barrier value specified before.
TAMA/USD Market
Key Levels
Resistance levels: $0.009000, $0.009500, $0.01000
Support levels: $0.007500, $0.007000, $0.006500
TAMA/USD Medium-term Chart
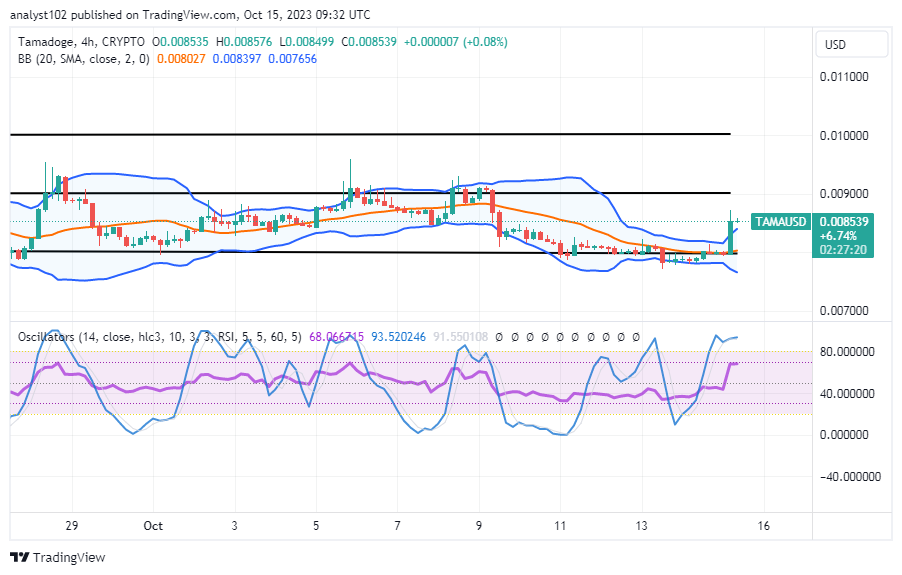
The TAMA/USD medium-term chart showcases that the crypto-economic price swings high after bears lacked the energy to breach more lower far beneath the $0.00800, averaging the resistance of $0.00900.
The stochastic oscillators have traversed northbound into the overbought region to place at 93.520246 and 68.066715. The Bollinger Band trend lines are positioned respectively at the upper part of $0.008397, the middle line is at $0.008027, and the lower side is at $0.007656. It implies that the market is on the move, contending with the breaking of resistances along the upper Bollinger Band.
With the TAMA/USD market trading at $0.08539, what does today’s candlestick reading index indicate?
A peep into the technical pushing pace from today’s trade chart showcases that bulls in the market operations of TAMA/USD stand better chances of gaining momentum to boost their presences on the long run, given that the crypto’s price swings high, averaging the resistance line of the $0.009000.
It is best not to quickly liquidate any long positions that may have been formed when the market hit an all-time low value around the point of $0.00600 up to the value of $0.00700. More positions are to be added, as indicated by indicators that the point of $0.00800 has been serving as the major point bears have been pushing against bulls. Traders should always keep in mind that this new trading instrument is anticipating a significant recovery in the next few months.
TAMA/USD Short-term chart
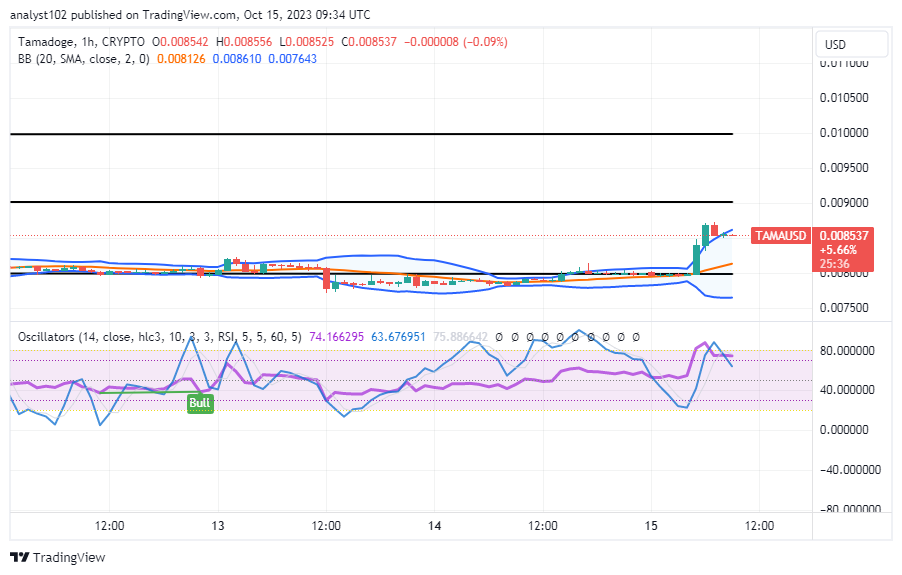
The TAMA/USD short-term chart shows that the crypto-economic market swings high after securing support from around the point of $0.008000, averaging the resistance line of $0.00900.
The Bollinger Bands’ location indicated the following points: $0.008610, $0.008126, and $0.007643 for their bottom portion, in that sequence of arrangements. The stochastic oscillators, which range from 74.166295 to 63.676951, are in a minor southbound-crossing phase. This demonstrates that buyers may still have some patience in order to have further ascending lines from the current bargaining zone of $0.008537.
Play Arcade Classics to Earn Money on Your Phone
Play to Earn Arcade Classics on your mobile ✌️
— TAMADOGE (@Tamadogecoin) October 14, 2023
Download Tamadoge Arcade and earn $TAMA now 👇
📱 Android: https://t.co/3PXpfUBjQh
📱 iOS: https://t.co/UN5MlRGOTC pic.twitter.com/vySpO1bxu0
Do you want a coin that would 100X in the next few months? That is Tamadoge. Buy TAMA today
Note:Forexschoolonline.com is not a financial advisor. Do your research before investing your funds in any financial asset or presented product or event. We are not responsible for your investing results.


Leave a Reply