Tamadoge Price Prediction – September 14
Variant pushes to the upside and the downside in the production of movements of the Tamadoge market versus the US currency have made headlines showcasing the crypto-economic price surges higher to hover around the point of $0.01100, exhausting energy.
Exhaustion of energy occurs when less-active forces are kept in transition mode for a number of hours because the market finds support in the area of a lower trading spot. In the interim, buyers may still need to exercise caution when making entries, especially if they want to close out their positions within the next several hours or days.
TAMA/USD Market
Key Levels
Resistance levels: $0.01200, $0.01250, $0.01300
Support levels: $0.009500, $0.009000, $0.008500
TAMA/USD Medium-term Chart
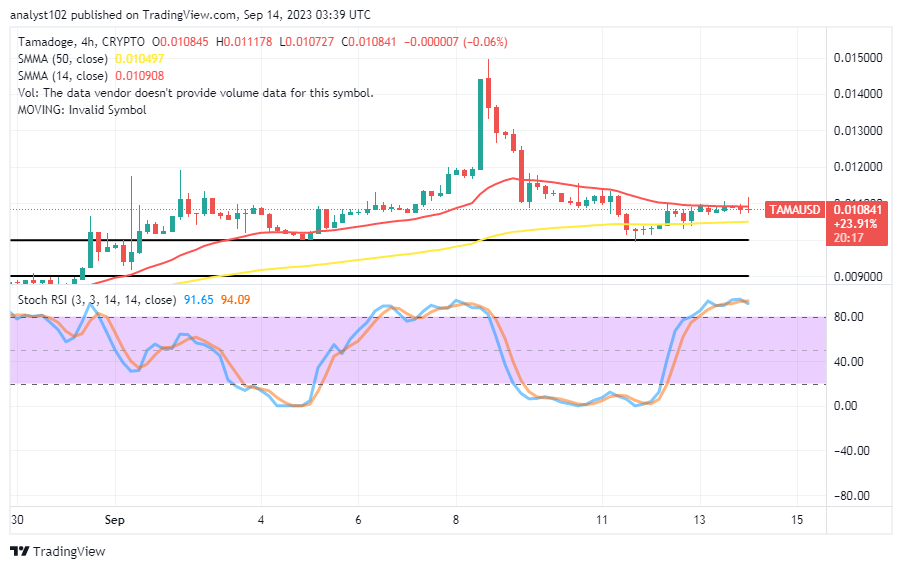
The TAMA/USD medium-term chart showcases the crypto-economic price surges in a slow and steady manner to the line of $0.01100, exhausting energy.
As of the time of this technical write-up, the indicators’ forming pattern suggests that long-position pushers will be taking their time to move in the right directions because the Stochastic Oscillators have moved from 94.09 to 01.65 values, signaling a warning index of a shift in the opposite direction that is likely to happen soon.
What does the TAMA/USD market’s current business posture say about the likely course of events going forward?
Even though an overbought reading condition has been obtained in the exchanging process between Tamadoge and the US coin, that doesn’t mean bears will by all means take charge of the movements soon, given that the crypto’s price surges to high values, exhausting energy at a low or fast pace, as it has been judged on a 4-hour trade chart.
The firm valuation is still undervalued in light of the bargaining position, and as a result, it ought to draw additional fund introduction interventions from long-position takers and investors who are willing to let their investments run for a long period without entertaining worry or panic. The crypto economy is gradually moving toward entering a bullish trending cycle over the coming few months, so keep that in mind.
TAMA/USD Short-term chart
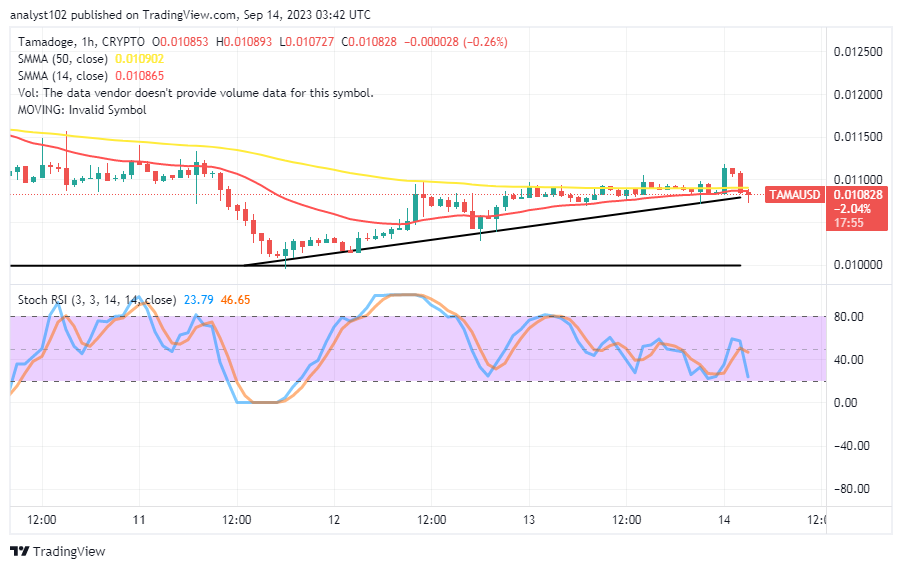
The TAMA/USD short-term chart reveals that the crypto market surges briefly with an unsustainable force past the point of $0.01100, showing that it is exhausting energy.
As a bearish candlestick is beefing up against the indicators, the 50-day SMA trend line has nearly stretched easterly over the 14-day SMA trend line. The Stochastic Oscillators are placing values between 46.65 and 23.79, indicating a southward cross. It implies that market declines are more likely than a quick market recovery.
Follow us on social media to learn about the newest, completely new Tamadoge revelation.
We’re launching Mystery Project 3 today.
— TAMADOGE (@Tamadogecoin) September 14, 2023
Stay tuned to our socials for the latest game changing Tamadoge reveal 🐶 pic.twitter.com/8VUIHJa7kF
Do you want a coin that would 100X in the next few months? That is Tamadoge. Buy TAMA today
Note:Forexschoolonline.com is not a financial advisor. Do your research before investing your funds in any financial asset or presented product or event. We are not responsible for your investing results.


Leave a Reply