Tamadoge Price Prediction – August 29
The last several hours witnessed a financial book of records showing that Tamadige market trading against the trade worthiness of the US coin showcases the crypto-economic price surges from a point before the support line of $0.00750, beefing up further in the process via resistance toward the point of $0.009000.
Long-position pushers are currently stacking positively between the trade zones of $0.008369 and $0.008434 at an average percentage rate of 0.14 as of the writing of this technical analysis article. The daily time frame’s continued pushing pace capacity is still a significant worry since it prevents new long position orders from stalling in the event that the resistance line of $0.01000 suddenly pushes aggressively. Only more time would be needed to eventually be able to push for steady upward strides.
TAMA/USD Market
Key Levels
Resistance levels: $0.009000, $0.009500, $0.01000
Support levels: $0.007500, $0.006500, $0.005500
TAMA/USD Medium-term Chart
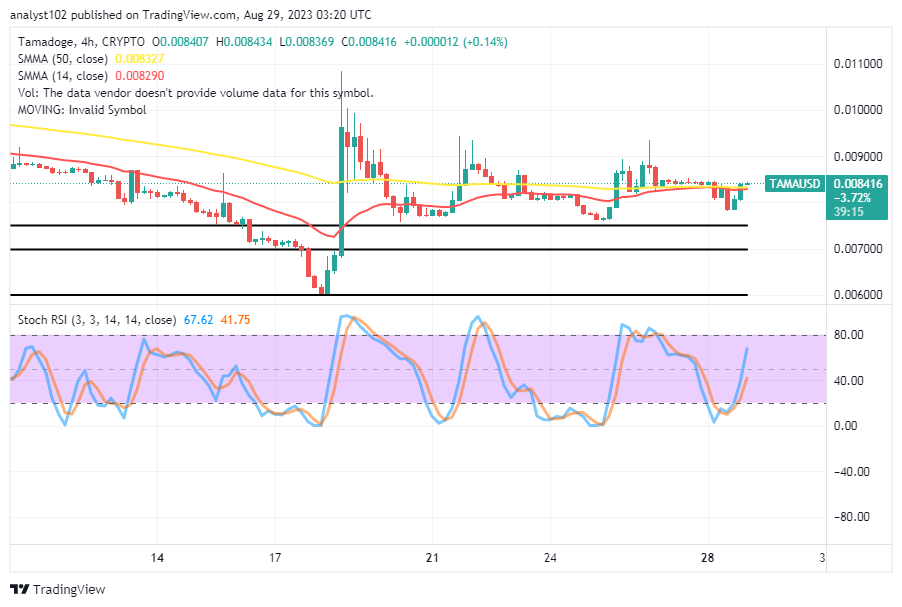
The TAMA/USD medium-term chart showcases the crypto market’s surge back into action before reaching the support level of $0.007500 and beefing up via resistance below $0.009000.
Around the point of $0.008300, the 50-day SMA indicator and the 14-day SMA indicator are tightly keeping their region. As of the time of this writing, the bullish candlestick’s beefing process was seen at $0.008416. The stochastic oscillators are positioned between 41.75 and 67.62 values, and they are in a crossing mode toward the north.
Will the TAMA/USD market buyers drive prices higher than the SMAs’ conjoined points?
The impulse level of the price in the TAMA/USD trade appears not going to be stable, even though the crypto market has been surging and beefing up via resistance of the conjoined spot of the SMA trend lines around $0.008290 and $0.008327.
The market will return to its previous course of starting the catalyst from scratch if a turn is made against the values forming the conjoint lines. As long as the support levels of $0.007500 and $0.008000 are still backing each order, it is still a suitable time for yearning position orders to stage in order to delay any potential falling moment that may return. 
TAMA/USD Short-term chart
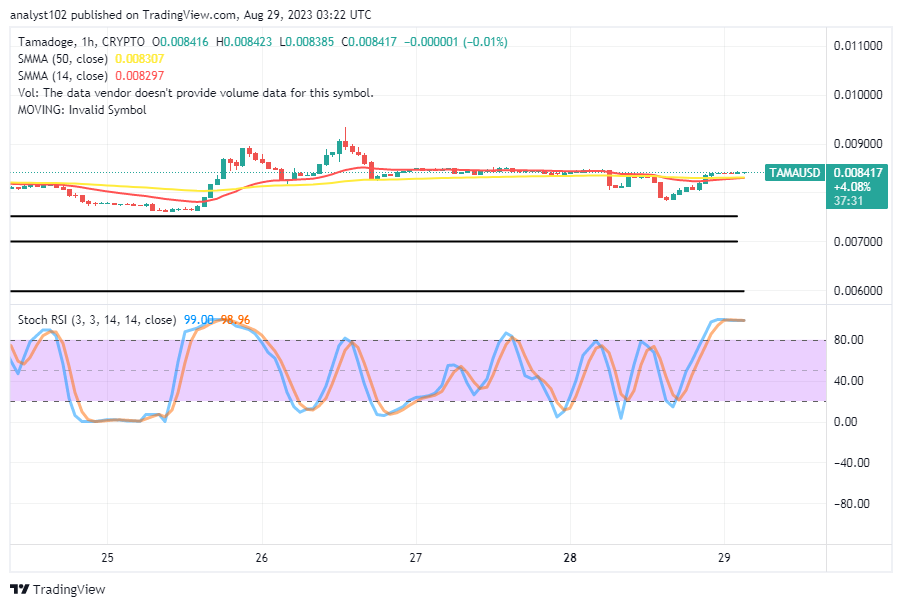
The TAMA/USD short-term chart showcases the crypto price surges, beefing up via resistance around the pints of the moving averages.
The 50-day SMA trend line and the 14-day SMA trend line are now connected. According to the short-term view, buyers may now feel more comfortable pushing prices higher after a string of bullish candlesticks helped them reach the highest point. The stochastic oscillators are still maintaining values between 98.96 and 99.00 despite entering the overbought area, raising a warning signal against further smooth northward running.
Army of Tama! The groundwork is laid, and we’re preparing for a major event! Listen to Jon Bishop, our CEO… and prepare
Tama Army! The foundations are in place and we’re gearing up for something big! Take a listen to our CEO Jon Bishop… and get ready 🌕🚀 pic.twitter.com/CgOyM1vtgi
— TAMADOGE (@Tamadogecoin) August 25, 2023
Do you want a coin that would 100X in the next few months? That is Tamadoge. Buy TAMA today
Note:Forexschoolonline.com is not a financial advisor. Do your research before investing your funds in any financial asset or presented product or event. We are not responsible for your investing results.


Leave a Reply