Tamadoge Price Prediction – August 21
The transaction between the Tamadoge price and the US currency steps down against the US currency after surging significantly, breaking through resistances toward the point of $0.009000, and it is currently recouping, hiking a bit above the level of $0.008000.
Indicating that neither buyers nor sellers are actively deciding to push the price away from the current line, a string of hovering market sessions have been occurring around the point of $0.008000. As of right now, if points between the $0.007000 line will only be used for making trustworthy upward swinging motions along with the value described earlier, a minimum minute percentage rate of 0.08 appears to indicate that bulls are somewhat trying to bounce back into the trades.
TAMA/USD Market
Key Levels
Resistance levels: $0.009000, $0.01000, $0.01100
Support levels: $0.007000, $0.006000, $0.005000
TAMA/USD Medium-term Chart
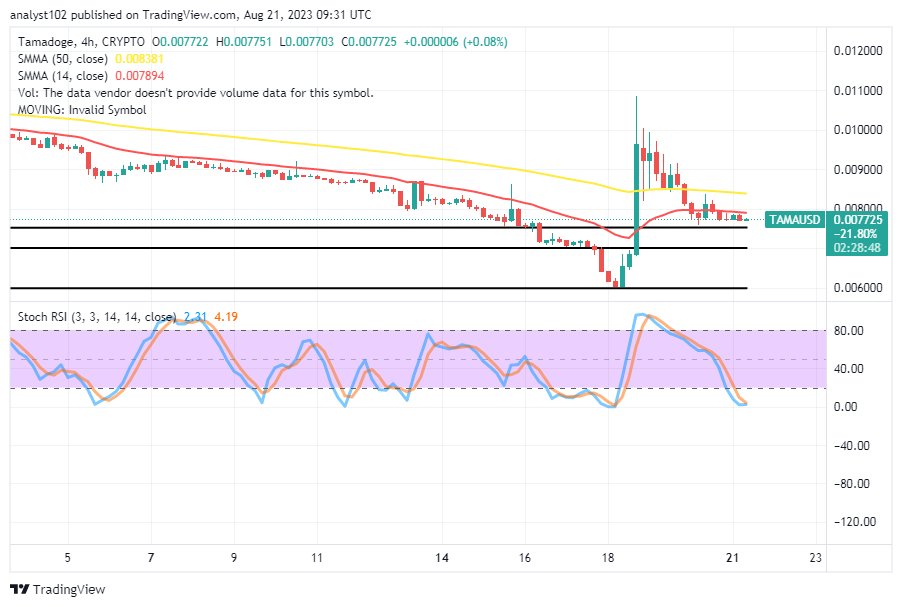
The TAMA/USD medium-term chart showcases the crypto-economic price steps down, presently moving sideways around the trade spot of $0.008000 with a trait of recouping hiking from the zone.
A brief glance at the forces’ inclination for long-term analysis from a daily chart indicates that steps may occasionally need to be taken before rises can be sustained. The 14-day SMA indicator is currently at $0.007894, which is beneath the 50-day SMA indicator’s value line of $0.008381. The stochastic oscillators, which hold the positions down from 4.19 to 2.31, are in the oversold region. This suggests that the velocity weight maintained at this stage of the market still has a chance of moving higher.
What is the current push situation in the TAMA/USD market operations?
Some indicators are now portending a slim probability of getting a definite direction from its current trading spot in the market activities of Tamadoge against the US coin, given that the crypto-economic price steps down, recouping hiking impute from around the point of $0.008000.
Fresh buying-back strategies may need to be used going forward because the value of the cryptocurrency has experienced a definite downward trend. The reading of the stochastic oscillators suggests that it is not essential to wait for the circumstances that will result in an oversold state. As things stand, trade points at or below $0.001100 are excellent buying or longing axes, regardless of how long the price of the base instrument stays below it based on the current trading setup.
TAMA/USD Short-term chart
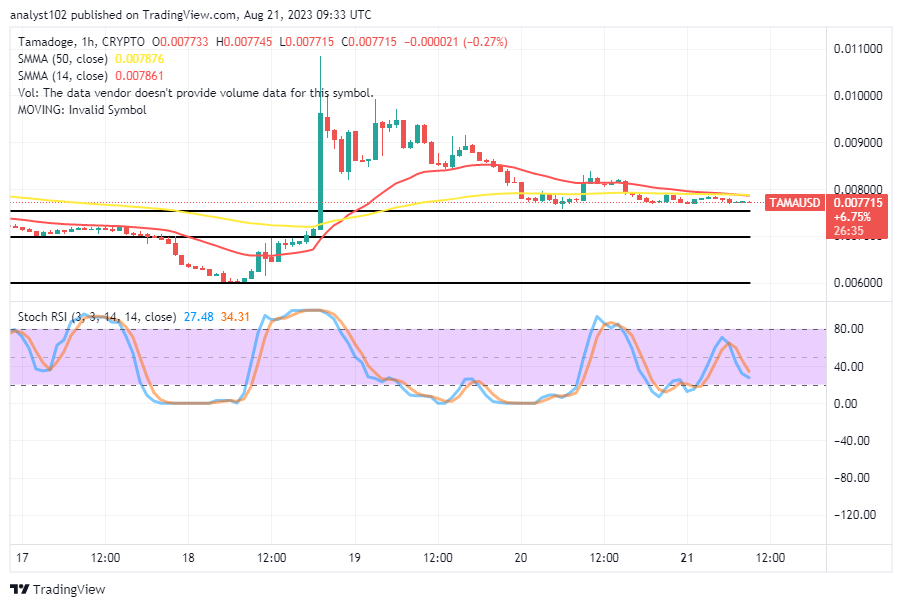
The TAMA/USD short-term chart showcases the crypto market’s steps down, recouping hiking, from a point near the line of $0.008000.
The 50-day SMA trend line and the 14-day SMA trend line are now joined. And they are close to $0.008000 to confirm that there is evidence of ranging actions. The stochastic oscillators are positioned tentatively between 34.31 and 27.48 values in a southbound-crossing mood. The market will need to maintain strong support above the psychological support level of $0.007500 in order to prevent further drops to lower levels of about $0.007000 and, potentially, an extension to $0.006000 in the long term. That is the current trading outlook from an hourly analytics angle. However, the conclusion that buying orders should be followed still stands.
Let’s avoid getting off to a bad start on Monday…
Let’s not start Monday on the wrong foot… 😉 pic.twitter.com/U0KFMDr4NO
— TAMADOGE (@Tamadogecoin) August 21, 2023
Do you want a coin that would 100X in the next few months? That is Tamadoge. Buy TAMA today
Note: Forexschoolonline.com is not a financial advisor. Do your research before investing your funds in any financial asset or presented product or event. We are not responsible for your investing results.


Leave a Reply