Tamadoge Price Prediction, December 26
A chain of negative forces has actively been playing out in the operations binding Tamadoge with the US currency, as the current financial condition showcases the crypto’s price staying down alongside the southward-stretching path of the lower Bollinger Band, building up catalysts.
Without a doubt, buyers are letting their muscles relax in the market to allow the price to adjust for required adjustments, allowing long-position pushers to quickly restore their positions and go back north. Investors are gradually seeing the emergence of a recurring course of dip-buying methods to continue developing upon declining worth lines. It won’t take long for a bouncing motion to appear.
TAMA/USD Market
Key Levels
Resistance levels: $0.010, $0.011, $0.012
Support levels:$0.00800, $0.0075, $0.0070
TAMA/USD Medium-term Chart
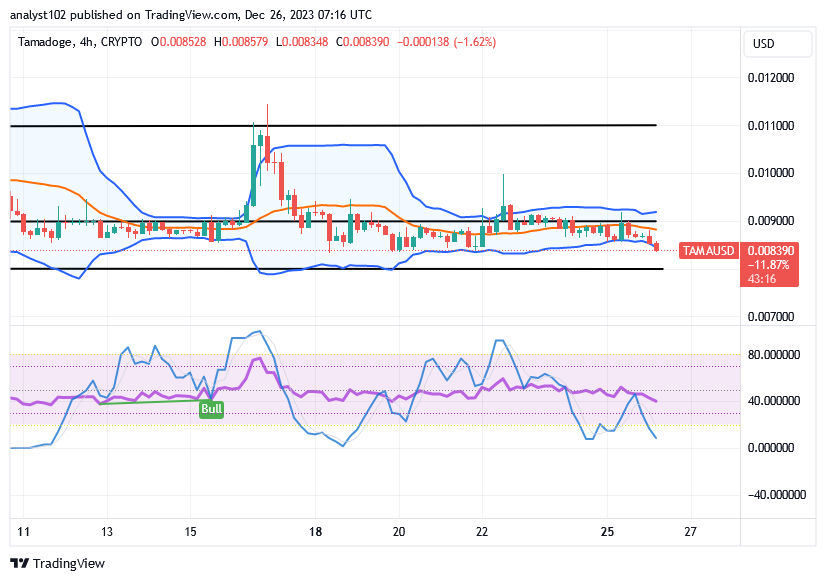
The TAMA/USD medium-term chart showcases that the crypto-economic price stays down, building up catalysts toward the support zone of $0.00800.
The Bollinger Band trend lines stretch at the lower part in compliance with the little falling force needed to approach the support of $0.00800. The stochastic oscillators have their blue parts pointing in the direction of the south in the oversold region. And, based on that, a bearish candlestick is in the making, believed to regenerate into an upswinging motion soon.
Is it better for purchasers psychologically to hold off until a recovery occurs when the TAMA/USD market is moving lower?
As it has been depicted that the TAMA/USD market is trading around the path of the lower Bollinger Band to the south, investors are expected to progress the activities of buying from the dips, given that the crypto market stays down, building up catalysts as the price usually goes in the opposite direction to the moon side around the lower Bollinger Band.
There has been a general consensus that sellers shouldn’t start moving closer to the lower Bollinger Band in the south. The stochastic oscillators’ current repositioning in the oversold area indicates that forces moving in the negative direction have accelerated to the point of mere fatigue, which might quickly turn new openings into traps. Anticipateably, a bounce will appear in the near future.
TAMA/USD short-term chart
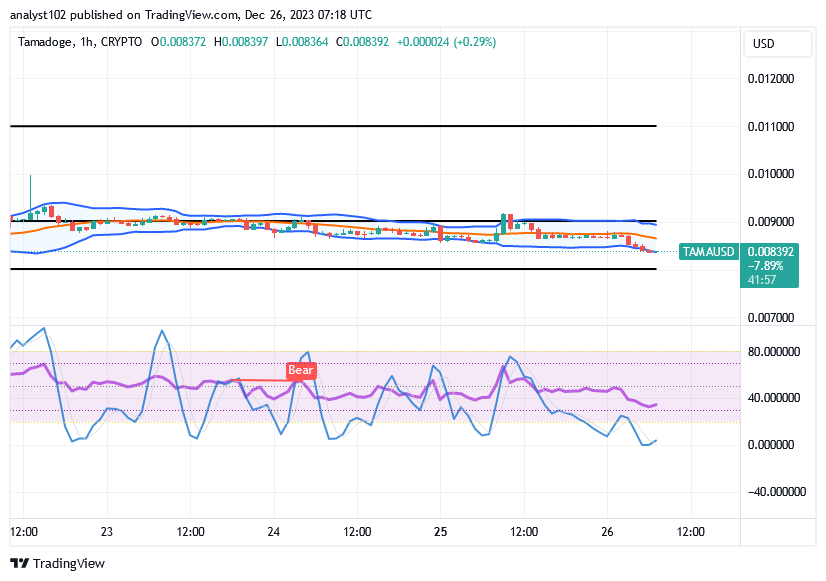
The TAMA/USD short-term chart reveals that the crypto market stays down, building up catalysts around the lower Bollinger Band.
The stochastic oscillators are oriented southward into the oversold area, suggesting that some steps have been taken to create leverage for bulls entering the market. In contrast to the market’s position for the US coin, the Bollinger Band trend lines are veering to the east, confirming that a sideways trend is still present in the crypto economy. Overall, now is a favorable moment for investors to begin taking long positions in these two corporate transactions.
Play five thrilling games, accumulate points, and get your $TAMA rewards. Download right now.
The Tamadoge Arcade is calling 🕹
— TAMADOGE (@Tamadogecoin) December 26, 2023
Play 5 exciting games, rack up those points, and claim your $TAMA prizes. Download now
📱 Android: https://t.co/OUHxpNLRFT
📱 iOS: https://t.co/BCCdGKHiYw pic.twitter.com/oxbkkg7AlQ
Do you want a coin that would 100X in the next few months? That is Tamadoge. Buy TAMA today
Note:Forexschoolonline.com is not a financial advisor. Do your research before investing your funds in any financial asset or presented product or event. We are not responsible for your investing results.


Leave a Reply