Tamadoge Price Prediction, March 8
There has been continuity in the way that movements of activities in the TAMA/USD market have been waving north and south as the crypto trade slows actions, conjecturing spikes in inputs.
It has been over a couple of different sessions that the unstable price movements have predominantly featured around the values of $0.008 and $0.007. And that situation has mostly caused indecision. Notwithstanding that presumption, there is a strong belief that bulls will outperform all other situations in the long-term running cycle.
TAMA/USD Market
Key Levels
Resistance levels: $0.0085, $0.0095, $0.0105
Support levels: $0.0065, $0.0055, $0.0045
TAMA/USD Medium-term Chart
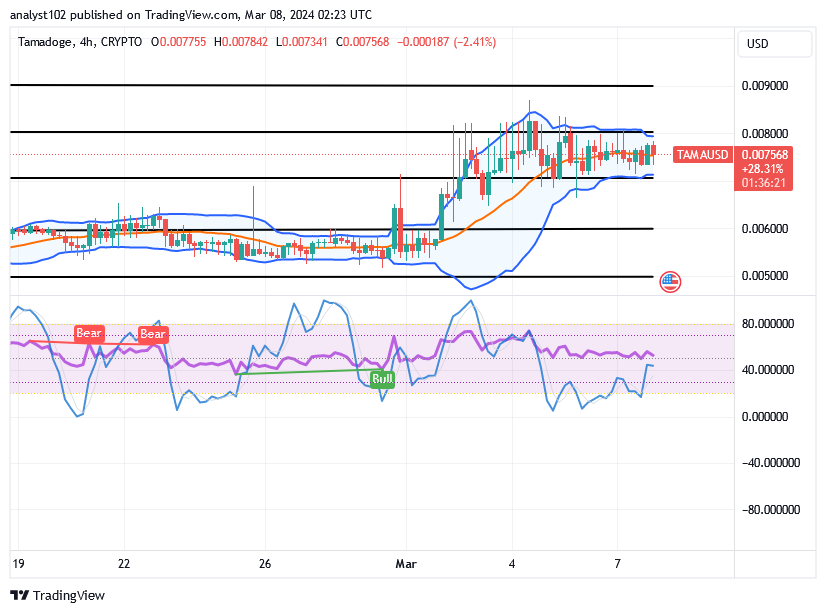
The TAMA/USD medium-term chart showcases that the crypto-economic market slows action, conjecturing spikes.
The stochastic oscillators have been having the blue part of the indicators, waggling to the east around the points that involve oversold regions to the zone of 40. That implies that some forces are gathering to back up rising moves. The Bollinger Band indicators have managed to push northward to a position around the points of $0.008 and $0.007. 
Should investors hold off if the TAMA/USD market continues to move between $0.008 and $0.007?
As long as the price valuation of Tamadoge remains undervalued against the American coin at this point, capitalists are to continue to take advantage of committing funds ahead of massive rebounds, as the current situation is slow, conjecturing spike signs.
If the emotion expressed is any indication to align with, the process of allocating money must proceed without fostering any fear of failure. When examining the issue from the perspective of a daily chart, it only becomes apparent that there might be some delays until the market is able to push ideally to the upside and establish the genuine nature of the emerging base trading instrument.
TAMA/USD short-term chart
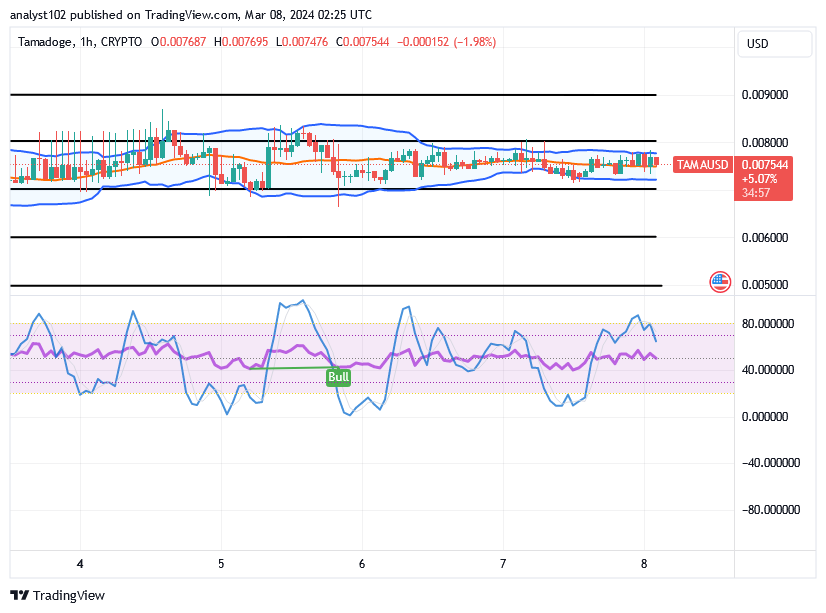
The TAMA/USD short-term chart showcases the crypto-economic market’s slow actions, conjecturing spike signals.
Based on the hourly configuration, the Bollinger Bands have been continuously extending eastward between $0.008 and $0.007. The blue portion of the stochastic oscillators has surged northward into an overbought area, indicating that a rising motion is approaching a relaxation phase. In the event of a significant bullish candlestick, the oscillators will undoubtedly run in an upward consolidation pattern.
Have fun, take care of, and feed your very own Tamadoge online!
Wash, Feed and play with your own virtual Tamadoge!
— TAMADOGE (@Tamadogecoin) January 9, 2024
The more you care for you pet the higher share of $TAMA you earn 🐶
Download now 👇
📱 Android: https://t.co/RfZIZOLaNJ
📱 iOS: https://t.co/du3iReizS4 pic.twitter.com/26PJ6CWDQH
Do you want a coin that would 100X in the next few months? That is Tamadoge. Buy TAMA today
Note: Forexschoolonline.com is not a financial advisor. Do your research before investing your funds in any financial asset or presented product or event. We are not responsible for your investing results.


Leave a Reply