Tamadoge Price Prediction – May 14
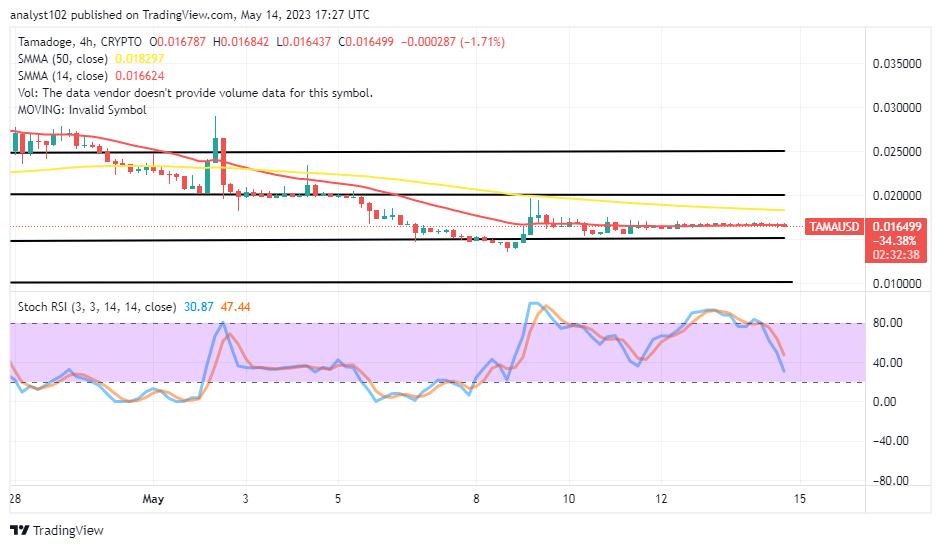
The TAMA/USD price shows signals for ups as it hovers faintly around a path eastwardly near the $0.01500 support line. As that sideways-moving mood establishing, buyers have not been able to push to the moon more than the $0.016842 high line of the low point of $0.016437 that sellers have only touched in terms of downward motion attempted. A negative percentage point of 1.71 has been to back the idea that this technical item is currently in favor through selling activity. Nevertheless, it’s a circumstance worth repurchasing.
TAMA/USD Market
Key Levels
Resistance levels: $0.02000, $0.02250, $0.02500
Support levels: $0.01250, $0.01000, $0.00750
TAMA/USD – 4-hour Chart
The TAMA/USD 4-hour chart showcases the crypto-economic price and shows signals for ups as it hovers in a tight line to the eastward alongside the trend line of the smaller SMA. The 50-day SMA indicator is at $0.018297 above the $0.016624 value of the 50-day SMA indicator. The Stochastic Oscillators have crossed southbound through some levels to 47.44 and 3087, indicating that a falling move is a card to a reasonable relative extent.
Should the TAMA/USD market buyers be wary of further declines below the $0.01500 support level\l?
The surfacing of further declines below the TAMA/USD trade $0.01500 support level will be to keep the path lowering toward getting lower better deals as the crypto-economic price shows signals for ups as it hovers consistently around the smaller SMA’s line. A false sharp move has to be toward the trading spot in question has to be made to be able to exhaust the falling force in the near time to swing back high.
The idea of trading along with a depression-moving route below the 14-day SMA indicator may not be forthcoming soon because the declining trend ability is in low-pushing capacity. Aside from that sentiment, we are not interested in placing new shorting position order even though there’ll be a tendency for losing from a breakout at the $0.02000 afterward.
TAMA/USD 1-hour chart
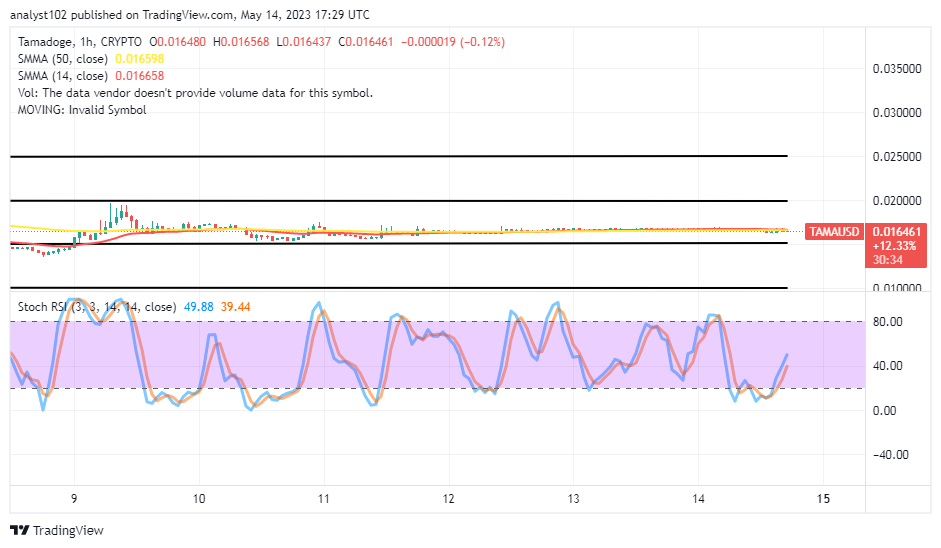
The TAMA/USD 1-hour chart showcases that the crypto-economic price shows signals for ups as it hovers tightly toward the east direction. The 50-day SMA and the 14-day SMA have merged around the range of the several candlesticks displayed. The Stochastic Oscillators are around 86.59 and 77.72 levels, seemingly trying to close soon around those points. In this short-term running outlook, bulls might still need to rebuild their energy from a lower trading zone before making smooth-up swings.
Forget about Babydoge, TAMA is winning! In the coming days, it will be listed on top CEXs.
Do you want a coin that would 100X in the next few months? That is Tamadoge. Buy TAMA today
Note: Forexschoolonline.com is not a financial advisor. Do your research before investing your funds in any financial asset or presented product or event. We are not responsible for your investing results.


Leave a Reply