Tamadoge Price Prediction – April 30
A reproduction of similar declining motions has persistently been upheld, and there is no room for the re-introduction of fresh shorting entries given that the TAMA/USD market presently settles for ranges, making hike signals.
This financial predicament can be attributed to the strategy of allowing bulls to accumulate catalysts in the long term. The assumed increasing moves are simply a question of time, regardless of how long it takes the market to surface around most of the indicators at any length of lower trading zones.
TAMA/USD Market
Key Levels
Resistance levels: $0.006, $0.007, $0.008
Support levels: $0.004, $0.0035, $0.003
TAMA/USD Medium-term Chart
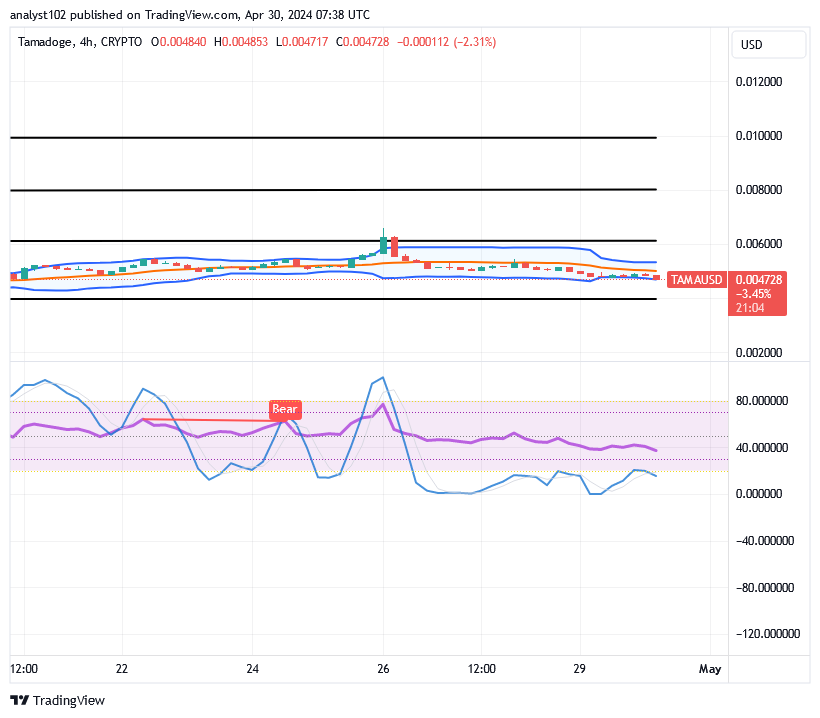
The TAMA/USD medium-term chart showcases the crypto-economic market settles for ranges, making hikes.
The Bollinger Bands trend lines are positioned in an eastward-stretching manner, keeping within the trend confinements of $0.006 and $0.004 with slight active motions to show that some leftovers of reduction are relatively dominating the market pace. The stochastic oscillators are moving in a consolidation style around the oversold region. That denotes that bulls are yet to make notable strides.
Should the TAMA/USD trade continue to feature around the lower Bollinger Band as a tip to pull out bulls?
A long process of the market around the lower Bollinger Band trend line should rather be seen as a situation to draw in formidable buying entry for capitalists, as the TAMA/USD trade settles for ranges at lower points, making hike indexes.
Given the psychological makeup of most long-position pushers, a provocation could result from the price extension at lower ends. The greater the negative trend in the market, the greater the opportunity for investors to jump on board and profit from the dips.
The TAMA/USD short-term
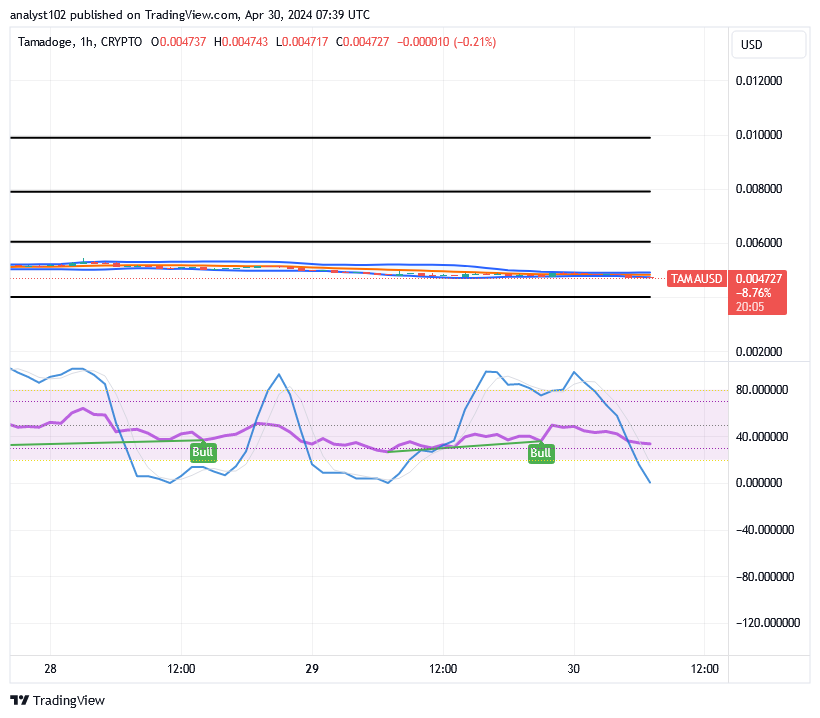
The TAMA/USD short-term chart reveals that the cryptocurrency trade settles for ranges, making hike signals from around the lower indicator.
Since the price has consistently been found to stay above the $0.004 mark, even over the long period, it is evident that the stochastic oscillators are in a southbound-crossing state, which highlights the risk of bouncing. In the $0.006 and $0.004 points, the Bollinger Band trend lines have contracted tightly, awaiting a terrifying move to split. In the foreseeable future, bulls are anticipated to be in charge of this market.
Join #TamadogePursuit, the trendiest mobile runner!
1️⃣ Register now to receive 20 complimentary credits as a power-up!
2️⃣ Go in and move up the leaderboards.
3️⃣ Weekly giveaways for top players mean rewards!
🏃♂️ Join the hottest mobile runner, #TamadogePursuit! 🎮
— TAMADOGE (@Tamadogecoin) April 30, 2024
1️⃣ Sign up – start with 20 free credits for a power-up!
2️⃣ Enter and climb the leaderboards
3️⃣ Win prizes with weekly giveaways for top players!
📱Android: https://t.co/Of8SYALRzL
📱 iOS: https://t.co/IthvqovwAH#P2E pic.twitter.com/LDZDudolfM
Do you want a coin that would 100X in the next few months? That is Tamadoge. Buy TAMA today
Note: Forexschoolonline.com it a financial advisor. Do your research before investing your funds in any financial asset or presented product or event. We are not responsible for your investing results.


Leave a Reply