Tamadoge Price Prediction, December 10
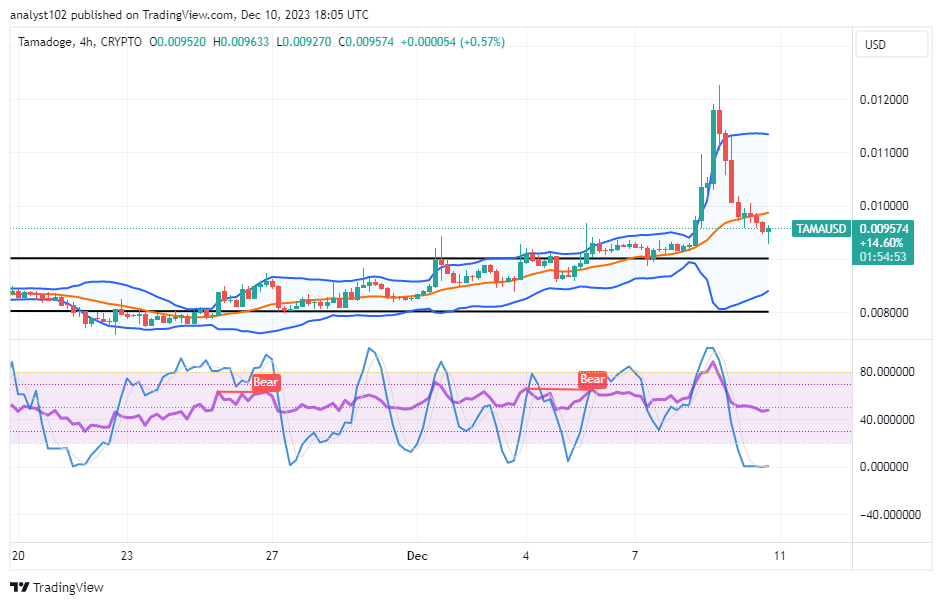
An aftermath trade happenings that have surfaced in the TAMA/USD market bulls and bears have turned to other round of pushing cycles, leading to seeing the crypto’s price reverses from around the point of $0.012, keeping a hike input above the value of $0.00900.
A look at the correctional motion from a technical analytics perspective shows that the forces acting on it don’t seem to be going away anytime soon. Therefore, another chain of dip buying activities will be observed if the market moves even lower than its current decrease cost. In order to stay on top of the market, investors would be wise to maintain their holdings, since this is usual for active, rising and declining movements.
TAMA/USD Market
Key Levels
Resistance levels: $0.012, $0.013, $0.014
Support levels:$0.00900, $0.00850, $0.00800
TAMA/USD Medium-term Chart
The TAMA/USD medium-term chart showcases the crypto-economic price reverses after hitting a resistance around point of $0.012, keeping a hike input.
The Stochastic Oscillators have traversed into the oversold region, driving in the depth area to demonstrate that sellers are in the control of the transactions of the crypto against the worth of the US coin. The Bollinger Band trend lines are positioned to give a probable line of underlying supports to be between $0.00900 and 40.00800 of the trade.
What should investors be considering right now in regards to the TAMA/USD market operations?
Investors may either have to start buying back into the market or allow other round of the Stochastic Oscillators to get reset in lower zones toward pointing back to the upside, especially on the daily time frame, given the TAMA?USD market reverses, keeping a hike input above $0.0080.
Based on the readings obtained from the daily chart, it seems that there may still be some residual drops that could occur, delaying the potential recovery of the crypto economy. As things stand, if the market continues to be pushed lower and there are abrupt movements in the other direction, the session might get erratic. The main claim is that purchasers ought to begin repurchasing the dips.
TAMA/USD short-term chart
The TAMA/USD short-term chart reveals the crypto-economic trade reverses following a hit of the barrier around the point of $0.012, keeping a hike input.
The Bollinger Band trend lines are currently making a bullish flag between the value lines of $0.010 and $0.00900, as per this technical analysis. Rising moments are slowly getting back, as shown by the stochastic oscillators being in the oversold area. There must be a financial commitment.
Just another day when I feed a croissant to my imaginary dog.
Just another day feeding my virtual dog a croissant 🥐
— TAMADOGE (@Tamadogecoin) December 10, 2023
Care, Grow & Earn with your own pet on Tamadogi now 👇
📱 Android: https://t.co/RfZIZOLaNJ
📱 iOS: https://t.co/du3iReizS4 pic.twitter.com/We3BIgBS1t
Do you want a coin that would 100X in the next few months? That is Tamadoge. Buy TAMA today
Note:Forexschoolonline.com is not a financial advisor. Do your research before investing your funds in any financial asset or presented product or event. We are not responsible for your investing results.


Leave a Reply