Tamadoge Price Prediction, November 27
There has been a tangible decline in the valuation of Tamadoge versus the worth of the US dollar, given that the crypto’s price reverses, drawing in spiking.
The current trade environment outlook indicates that the southerly velocity will continue to decline for some time. It is advised that long-term investors start leveraging the current declining trend. The motion would probably approach the lower trend line of the Bollinger Band in order to complete the requisite movement if the fall-offs kept becoming more severe.
TAMA/USD Market
Key Levels
Resistance levels: $0.0085, $0.009000, $0.009500
Support levels: $0.007500, $0.007000, $0.006500
TAMA/USD Medium-term Chart
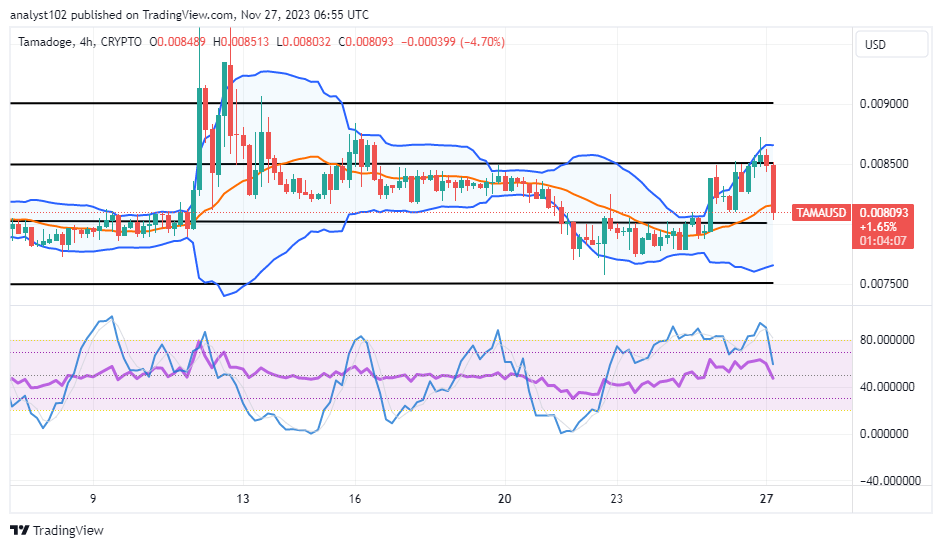
The TAMA/USD medium-term chart showcases the crypto-economic price reverse from the value of $0.085, drawing in a spiking signal.
At the upper side of the pint of $0.085, the Bollinger Band trend lines are now putting a clear barrier-trading signal around it. With a maximum downward trend from the upper end of the indicators against the middle region, a bearish candlestick is beginning to form. The lower Bollinger Band is still situated marginally above the $0.07500 underlying support level. From the overbought area, the stochastic oscillators are moving southward and are situated just above the 40. It demonstrates that a selling force is in control right now.
What is the price-directional force the TAMA/USD market is currently facing?
As of this technical piece, the TAMA/USD market is presently heading down against the trend line of the middle Bollinger Band to possibly reach the point of $0.07500 as the crypto market reverses, drawing in spiking traits.
A lengthy bearish 4-hour candlestick has emerged, suggesting that further sliding is likely to occur before bulls continue to accumulate positions at lower rates. Before deciding when to make a second longing entry, buyers might not need to wait for the stochastic oscillators to reposition themselves in lower trading zones. As a result, it is important to maintain position accumulation.
TAMA/USD short-term chart
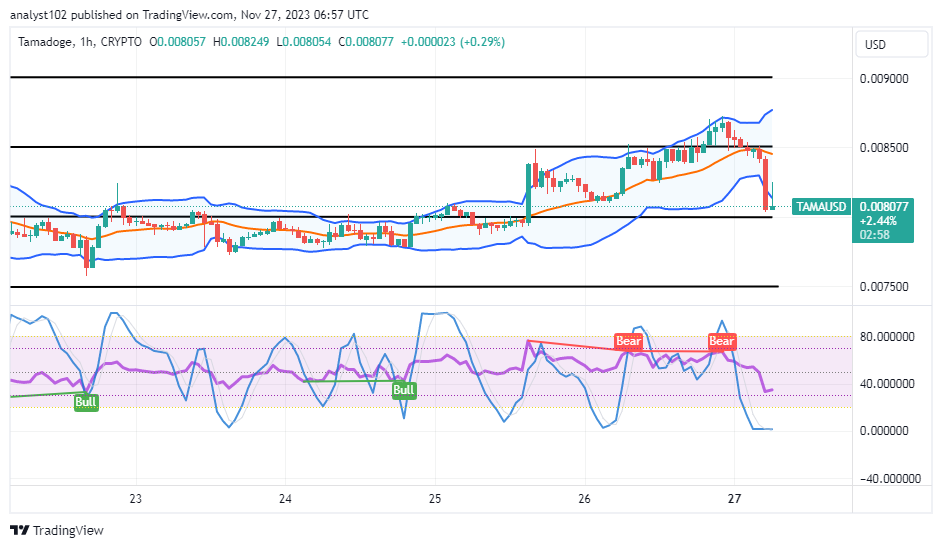
The TAMA/USD short-term chart depicts the crypto-economic trade reverses, drawing in spiking signs.
From the middle Bollinger band trend line, a long bearish candlestick has emerged and touched the lower Bollinger band. The oversold area has been breached by the stochastic oscillators. There is a tendency for the gravitational force to decrease, producing more lows. For bulls, it would be an excellent round of buying time.
Taking care of your own dog can help you earn TAMA.
Our new free-to-play app Tamadogi is coming soon 🎉
— TAMADOGE (@Tamadogecoin) November 24, 2023
Take care of your very own doge and earn $TAMA at the same time ❤️
Coming to iOS & Android! pic.twitter.com/IPg7Tgxf2m
Do you want a coin that would 100X in the next few months? That is Tamadoge. Buy TAMA today
Note:Forexschoolonline.com is not a financial advisor. Do your research before investing your funds in any financial asset or presented product or event. We are not responsible for your investing results.


Leave a Reply