Tamadoge Price Prediction – April 27
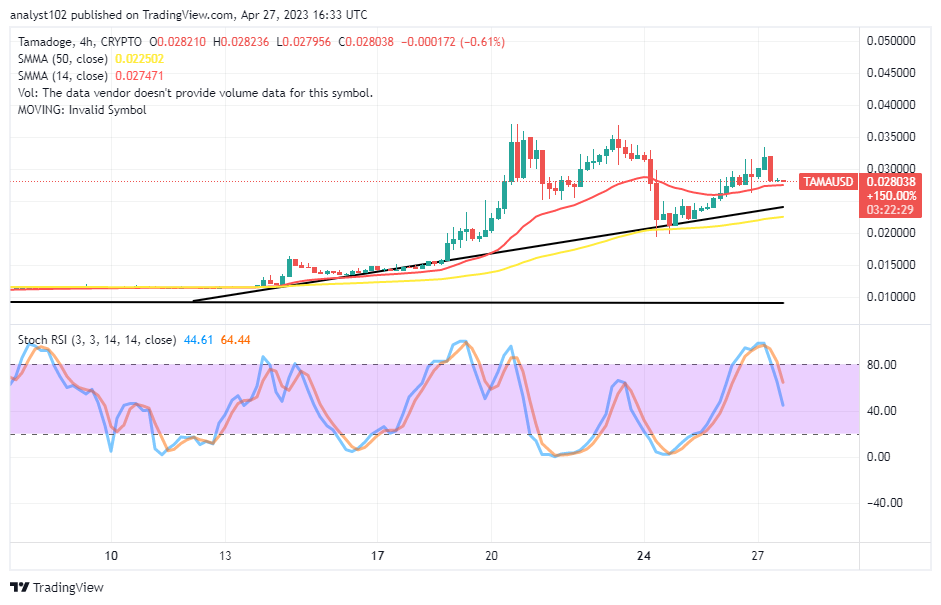
Tamadoge’s price retraces over the buying signal side of the trading indicators against the US Dollar. That correction has created trading zones between the high of $0.028236 and the low of $0.0227956 lines. The crypto-economic price is around $0.028038, keeping a minute negative percentage rate of 0.61. The situation portends that sellers may still dwell more on the slight declines for some hours.
TAMA/USD Market
Key Levels
Resistance levels: $0.03000, $0.03500, $0.04000
Support levels: $0.02000, $0.01500, $0.01000
TAMA/USD – 4-hour Chart
The TAMA/USD 4-hour chart showcases the crypto-economic price retraces over the buying signal side of the trend lines of the SMAs. A chain of candlesticks has formed, formally showcasing a prevalence of bullish candlesticks northward across the trend line of the smaller SMA. The 50-day SMA indicator maintains a point at $0.022502, underneath the $0.027471 value of the 14-day SMA indicator. The Stochastic Oscillators have crossed southbound to 64.44 and 44.61 levels, suggesting a decline may still occur.
Should TAMA/USD buyers stay off the market during this retracement phase?
Considering that the Tamadoge is one of the best-emerging cryptocurrencies, long-position placers should be less worried about any signs of reduction in its valuation as it has been that the price is retracing over the buying signal side of the SMA trend lines. Since a bearish candlestick has formed against the smaller indication, new perspective long-position takers may begin introducing part of their funds with reduced leverage. However, investors should wait as long as possible before taking profits from their positions.
On the downside of the TAMA/USD technical analysis, selling activities should have taken around the $0.030000 higher-trading point. Following the break of the 14-day SMA’s point at $0.027471, subsequent downward forces may quickly end. Therefore, shorting additional positions near the 50-day SMA’s support will result in an unnecessary bear trap situation.
TAMA/USD 1-hour chart
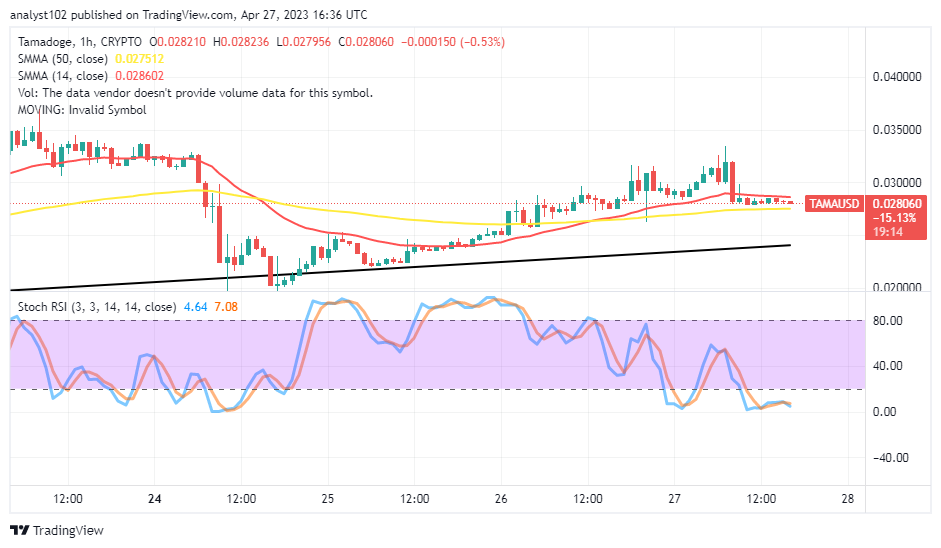
The TAMA/USD 1-hour chart reveals the crypto-economic price retraces over the buying signal side to consolidate closely underneath the trend line of the smaller SMA. The space between the two trading indicators is tight as the 14-day SMA is at $0.028602, and the 50-day SMA is at $0.027512. The Stochastic Oscillators are in the oversold region, keeping 7.08 and 4.64 to signify that a fall-off trading moment is thriving as at the writing of this technical analysis. Nevertheless, buyers and investors should nurse the myth of holding their positions.
Forget about Babydoge, TAMA is winning! In the coming days, it will be listed on top CEXs.
https://twitter.com/Tamadogecoin/status/1651949524426846210/photo/1
Do you want a coin that would 100X in the next few months? That is Tamadoge. Buy TAMA today
Note: Forexschoolonline.com is not a financial advisor. Do your research before investing your funds in any financial asset or presented product or event. We are not responsible for your investing results.


Leave a Reply