Tamadoge Price Prediction, December 17
Recently, the capacity of buying forces has been able to push briefly to touch some resistances around the line of $0.011 in the TAMA/USD market operations, given that the crypto-economic price is tending to build back a bounce base even in the phase of the fall-off at this time.
Given that there has been a trend toward more lows, this presents a chance to provide lower charges for the former trading instrument relative to the valuation of its later counterpart. Even though there will likely be more declines, now, at $0.009325, is an excellent time to start the buying process. It has been estimated that, in the long run, the price may only move as far south as $0.00800.
TAMA/USD Market
Key Levels
Resistance levels: $0.010, $0.011, $0.012
Support levels:$0.00800, $0.0075, $0.0070
TAMA/USD Medium-term Chart
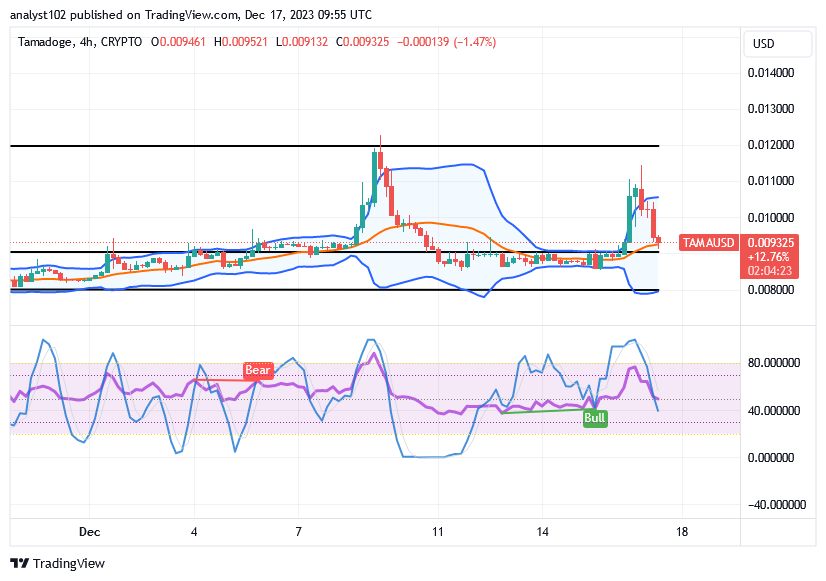
The TAMA/USD medium-term chart showcases the crypto-economy price reduction after seeing a resistance around the point of $0.011, attempting to build up a bounce base.
As it has been obtained, the formation of about four different 4-hour candlesticks has indicated that bears are firmly pushing at a negative percentage rate of 1.47. The Bollinger Band trend lines are widely opened around the values of $0.011 and $0.00800, with their middle part placed around the point of $0.00900. The stochastic oscillators are in a southbound-crossing manner, keeping a stand around the point of 40.
Will the bears in the TAMA/USD market continue to press for lows at $0.00800?
As there has been a drop averaging the point of $0.0090 at a closer range in the operations of the TAMA/USD market, the highest expected for more lows is $0.00800, given that the crypto’s price will reduce to rebuild a bounce base in the near future.
As the declining gravitational force has been falling in, dip-buying procedures are to be carried alongside it ahead of any possible unprecedented rebounding index. Therefore, accumulation of more positions is encouraged while there is a falling moment around the middle Bollinger Band and its beneath at any material trade value.
TAMA/USD short-term chart
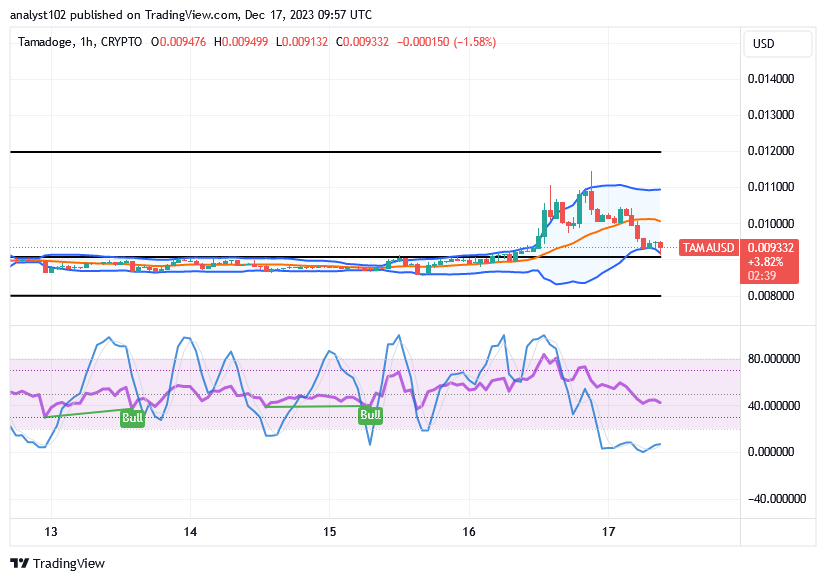
The TAMA/USD short-term chart reveals the crypto’s price has decreased, trying to rebuild a bounce base.
It’s possible that the bounce base rebuilding process won’t start on time when it approaches the lower Bollinger Band trend line after an hour. The stochastic oscillators are moving in a consolidation phase and positioning themselves near the oversold area. A bullish candlestick emerging from a lower trading zone will indicate that more advances are likely to occur.
While taking care of your pet, earn $TAMA!
Earn $TAMA while caring for your pet!
— TAMADOGE (@Tamadogecoin) December 16, 2023
Download Tamadogi on Android and iOS now 👇
📱 Android: https://t.co/RfZIZOLaNJ
📱 iOS: https://t.co/du3iReizS4 pic.twitter.com/6ELN99kdae
Do you want a coin that would 100X in the next few months? That is Tamadoge. Buy TAMA today
Note:Forexschoolonline.com is not a financial advisor. Do your research before investing your funds in any financial asset or presented product or event. We are not responsible for your investing results.


Leave a Reply