Tamadoge Price Prediction, January 22
There has been a confirmatory signal denoting that bears have been staging predominantly without letting in a chance for a shorting entry order as the TAMA/USD market pushes lowly, building a hike index along the line.
Investors shouldn’t let the fact that there have been varying lengths of losses in lower low moving motions deceive them ahead of a potential rebounding force that is anticipated to emerge in an effort to recover through the majority of the negative movements. No matter how long it takes, the underlying trade supports from $0.0065 to $0.0055 will continue to be the most reliable reduction locations ever for long-position traders and long-term investors to enter the market throughout its present retracement process.
TAMA/USD Market
Key Levels
Resistance levels: $0.0070, $0.0075, $0.0080
Support levels: $0.0065, $0.0060, $0.0055
TAMA/USD Medium-term Chart
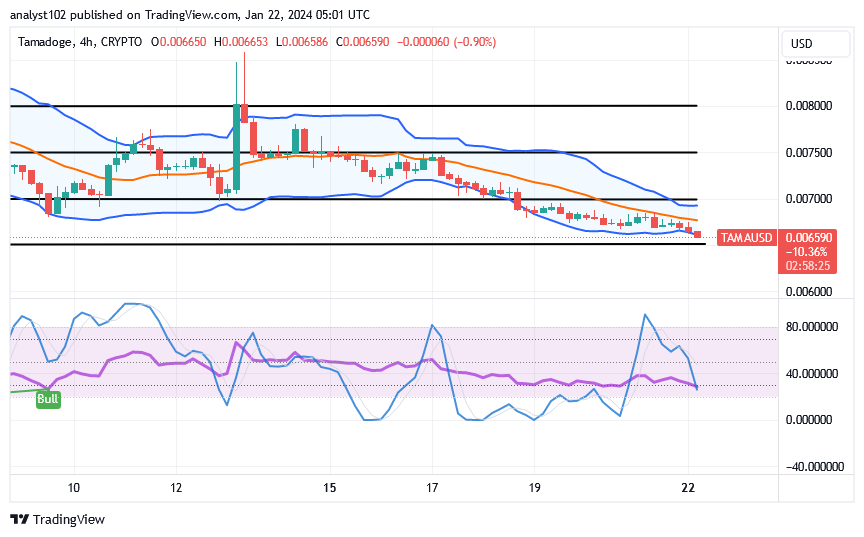
The TAMA/USD medium-term chart reveals the cryptocurrency market pushes lowly, building a hike index around the path of the lower Bollinger Band.
The Bollinger Band trend lines have been made to bend southerly alongside the forces that are making the moves to regain a surging input to put the market line below the barrier line of $0.0070. The stochastic oscillators have been having the blue line get closer to its second part on the downside.
Technically speaking, is today’s TAMA/USD market downturn the best time for investors to sell their holdings?
The long prevalence of declines in the valuation of the TAMA/USD market is serving as a major opportunity toward getting considerable buy orders, given that the crypto economy pushes lowly, building a hike index.
Buyers have a long-standing opportunity to keep accumulating trading positions in order to hold valuable holdings at discounted prices. When it comes to placing orders for lengthy positions, traders should be strategic and increase their equity to avoid being so short that they face a margin call. Another way to do that would be to avoid opening multiple positions.
TAMA/USD short-term chart
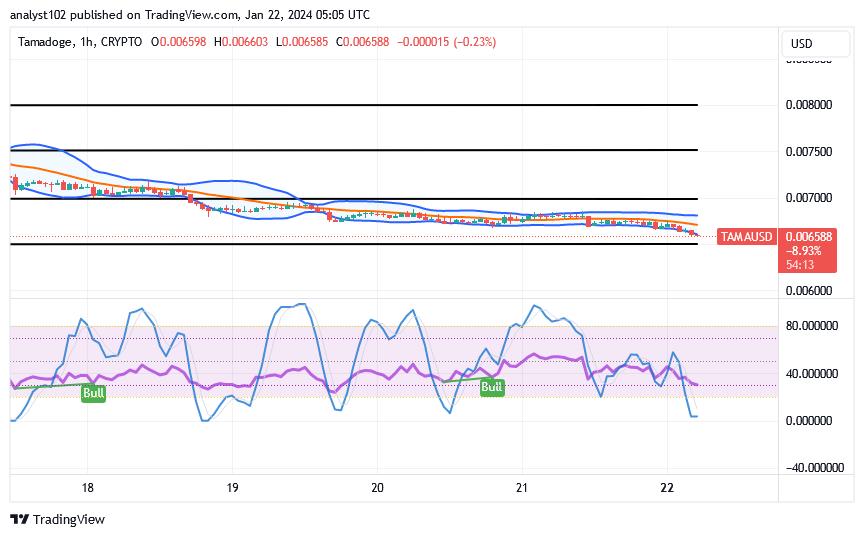
The TAMA/USD short-term chart reveals the crypto market pushes lowly, building a hike index around the lower Bollinger Band.
The stochastic oscillators have entered the oversold area, suggesting that there may be more declines in store. The trend lines of the Bollinger Band have been excessively extended southward in the range-bound regions of $0.0070 and $0.0065. Buying activities are expected to continue, irrespective of how long they take.
Play Tamadoge Arena Challenge mode against other players to wager, challenge, and win big.
A free 20 credits are awarded to new players!
Bet, challenge, and win big against other players in Tamadoge Arena Challenge mode 🎉
— TAMADOGE (@Tamadogecoin) January 2, 2024
New players start with 20 FREE credits!
Download on iOS & Android 👇
📱 Android: https://t.co/dB4zatlCdy
📱 iOS: https://t.co/PiDAjnDmaZ pic.twitter.com/Slr3lpevjP
Do you want a coin that would 100X in the next few months? That is Tamadoge. Buy TAMA today
Note:Forexschoolonline.com is not a financial advisor. Do your research before investing your funds in any financial asset or presented product or event. We are not responsible for your investing results.


Leave a Reply