Tamadoge Price Prediction – May 6
From the method that oscillators have resorted to pushing through the present, it is depicted that the TAMA/USD market currently presses lower, nurturing hike inputs.
The bull and bear long-holding trading stance above the $0.004 line appears to be further extending, presumably to mislead purchasers into ignoring the strategy of acquiring further holdings. If such is the case, investors should never panic and sell, even if the price tries to dip below the $0.004 mark. This is because supposed moves like that might trigger the velocities to climb again, leading to excellent rebounds later.
TAMA/USD Market
Key Levels
Resistance levels: $0.006, $0.007, $0.008
Support levels: $0.004, $0.0035, $0.003
TAMA/USD Medium-term Chart
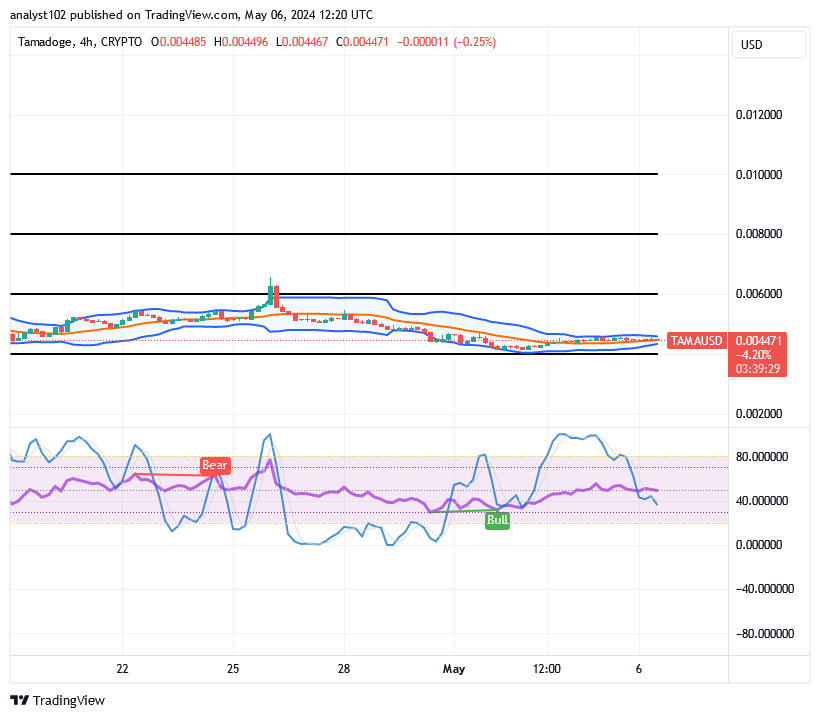
The TAMA/USD medium-term chart reveals that the crypto-economic price presses lower, nurturing increasing inputs.
As long as the $0.004 point holds firmly against any additional drops, the technical layout postures of the Bollinger Bands trend lines have been looking toward creating a region that might pave a route toward attaining a bullish flag formation. The stochastic oscillators are positioned about a point below the 40-point, with the blue component slightly crossing the red part to the south.
If the price crosses $0.004 to the downside, will the bears in the TAMA/USD market continue to dominate?
The dominance propensity of short-position movers lacks the logical sense to generate reliable moves in the long run even if the TAMA/USD market goes under its capacity base to stay above $0.004, as the present financial situation reports that the price presses lower slightly, nurturing increasing inputs.
The $0.004 exchange value line is clearly still in place, despite the general consensus that it would be the most important location to prevent unfettered fall-offs. Since it is believable that the current trending cycle in the events of crypto economies is turning bullish, buyers and others of a similar disposition should strategically hold onto their purchases even if the trades shift significantly to a lower zone, that will mean it has reached a tangible logical end before it reverts to a rallying moving mode afterward.
The TAMA/USD short-term
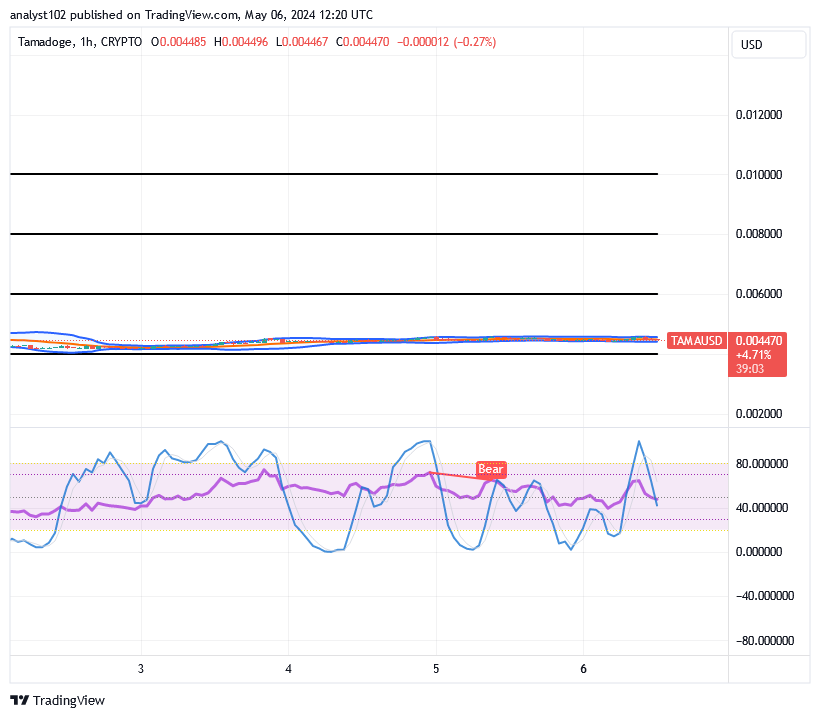
The TAMA/USD short-term chart showcases the crypto market presses lower on a lighter mode in the indicators, nurturing increasing inputs.
The stochastic oscillators appear to be moving more slowly downward as they are briefly crossing over from the overbought area to the south side at position around 40. The trend lines of the Bollinger Bands have consistently extended eastward at small intervals, falling between $0.005 and $0.004.
Monday Motivation 🐾
— TAMADOGE (@Tamadogecoin) May 6, 2024
Can you beat a top score? 🤔 Show us what you and your pet are made of! 🐶
Track your progress real-time. Get exclusive $TAMA rewards on #Tamadogi 🏆
👉 Sign up and get a free Puppy #NFT. Use your 20 free credits to get on the leaderboard 😄 #Tamaverse pic.twitter.com/6Z3Q5LdDL9
Do you want a coin that would 100X in the next few months? That is Tamadoge. Buy TAMA today
Note: Forexschoolonline.com it a financial advisor. Do your research before investing your funds in any financial asset or presented product or event. We are not responsible for your investing results.


Leave a Reply