Tamadoge Price Prediction – August 9
There have been systemically slow-and-steady features of lower low s in the market dealing lines of Tamadoge versus the valuation of the US currency as the crypto price presses lower, holding a bounce trait signal.
The price is currently trading in a lowly depreciative mood below the point of $0.009000 after failing to surge back upward through a line of close resistances of about the value of $0.00950. Although it has been coming on tighter and less active, a sharp analysis of the current depression force from the perspective of a higher time frame reveals that a few more lower lows are still on the agenda with the intention of giving investors more opportunity to buy from the deepening dipping pressure.
TAMA/USD Market
Key Levels
Resistance levels: $0.009500, $0.010000, $0.010500
Support levels: $0.008500, $0.007500, $0.006500
TAMA/USD Medium-term Chart
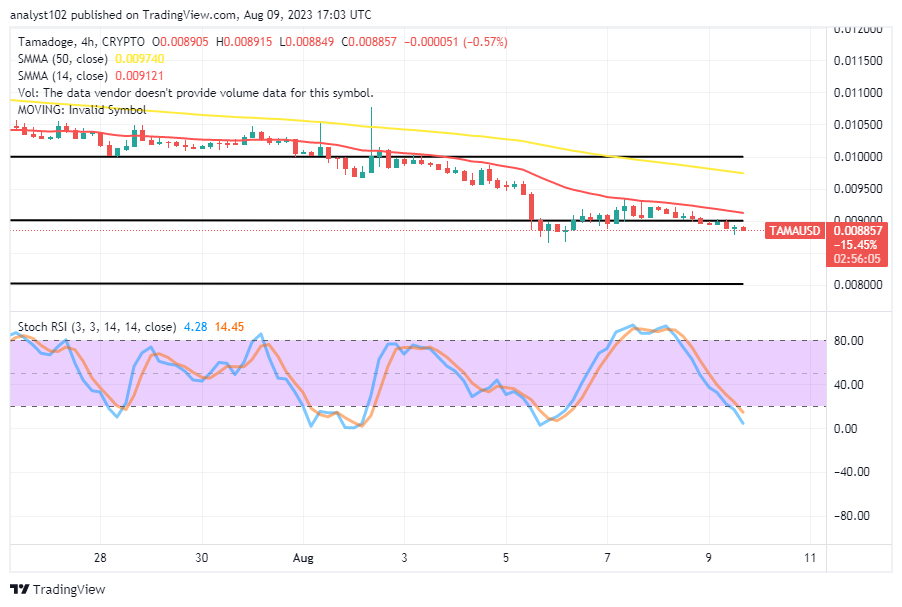
The TAMA/USD medium-term chart showcases the crypto-economic price pressing lower, holding a bounce imputed from underneath the lighter Moving Average trend line.
The 14-day SMA indicator is $0.009121 below the $0.009740 of the 50-day SMA indicator. The smaller trend line’s point marks the main barrier toward getting a stable increase if it is eventually breached northward. The Stochastic Oscillators have southbound values between 14.45 and 4.28.
Is there a potential for the US currency market to put TAMA under further pressure by lowering the supports in its current trade zone?
As it has been psychologically mirrored from the side of a daily time frame, it appears that more lower underlying support points will break through in the TAMA/USD trade operations as even the crypto’s price presses lower, holding a bounce sense.
Due to the current situation, which hasn’t started producing consistent increases in the market value of Tamadoge relative to the purchasing weight of the US coin over a few sessions up until the time of this article, investors and those who place long positions may become anxious. Another lower trade zone for the cryptocurrency’s recovery process has been established, and it will most likely reappear eventually between $0.008500 and $0.008000.
TAMA/USD Short-term chart
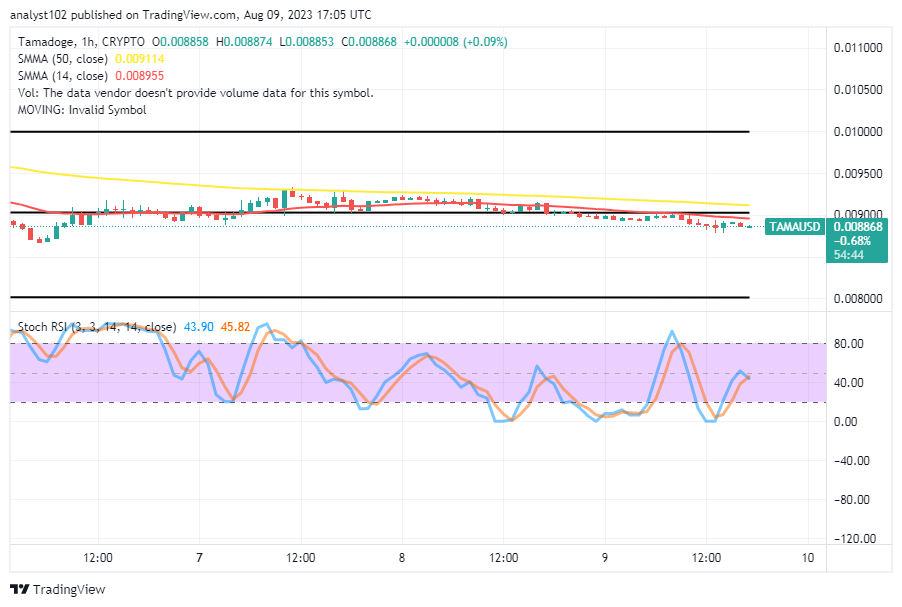
The TAMA/USD short-term chart showcases how the crypto-economic price presses lower, holding a promissory bounce.
The fact that the 14-day SMA indicator is below the 50-day SMA signal shows that the market has consistently been forced downward in order to provide buying operations time to gain additional momentum before the basic trading instrument’s long-term predicted explosion. Initially emerging from the oversold area, the stochastic oscillators are now attempting to close the lines at approximately 40.
This gif wasn’t created by us, we discovered it on the internet. And we aren’t angry.
We didn’t make this gif. We found it on the internet. And we’re not mad. pic.twitter.com/t4XD113Gou
— TAMADOGE (@Tamadogecoin) August 3, 2023
Do you want a coin that would 100X in the next few months? That is Tamadoge. Buy TAMA today
Note: Forexschoolonline.com is not a financial advisor. Do your research before investing your funds in any financial asset or presented product or event. We are not responsible for your investing results.


Leave a Reply