Tamadoge Price Prediction – September 17
As the trade myth toward securing stable up-strides has equally made bulls suffer sizeable lower lows, causing bulls to settle for recoups from lower ends most times, it is now making the TAMA/USD market portend hikes, retaining a base.
The trading zones between $0.002 and $0.00075 have been the main resistance and support levels for choices over the course of a few sessions. Practice has demonstrated that the effect bears have had on the cryptocurrency market has been to drive prices down to an extremely low value before they stabilize and rise again.
Key Levels
Resistance levels: $0.002, $0.003, $0.004
Support levels: $0.00075, $0.0005, $0.00025
TAMA/USD Medium-term Chart
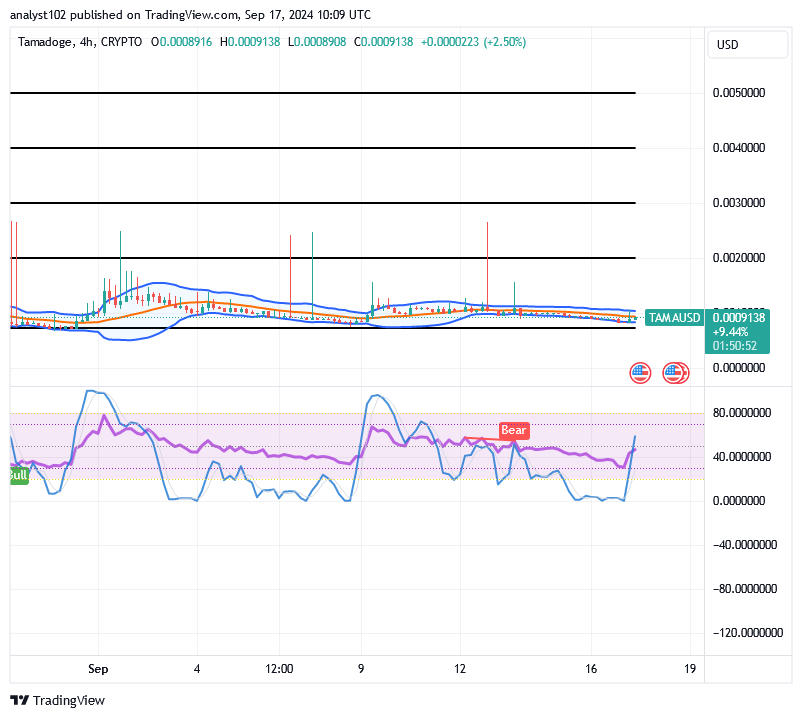
The medium-term TAMA/USD chart mirrors the crypto-economic price portends hikes, retaining a base.
The featured style of the candlesticks has been a provision of variant bottoms above the critical underlying support of $0.00075. The Bollinger Bands’ present positioning view is centered on the candlesticks and resembles a bullish flag. The stochastic oscillators are exhibiting an upward swerving strategy. And that suggests that Price is making an effort to become well-known up north.
Should investors in the TAMA/USD market proceed to execute more staking orders based on the indicators?
As there has been a continual system of making sudden rebounds in the crypto business operations in the past and until the present, it is technically ideal for capitalists to not back out from dip buys, as the TAMA/USD market currently portends hikes, retaining a base.
It is evident from the logical stance that the stochastic oscillators have taken as of this writing that there are purchasing pressures at a midway point towards the north side. The upcoming trading days are probably going to see a sudden spike that can push the expected advances to boldly place above the $0.002 barrier zones in the long-term running manner.
The TAMA/USD short-term
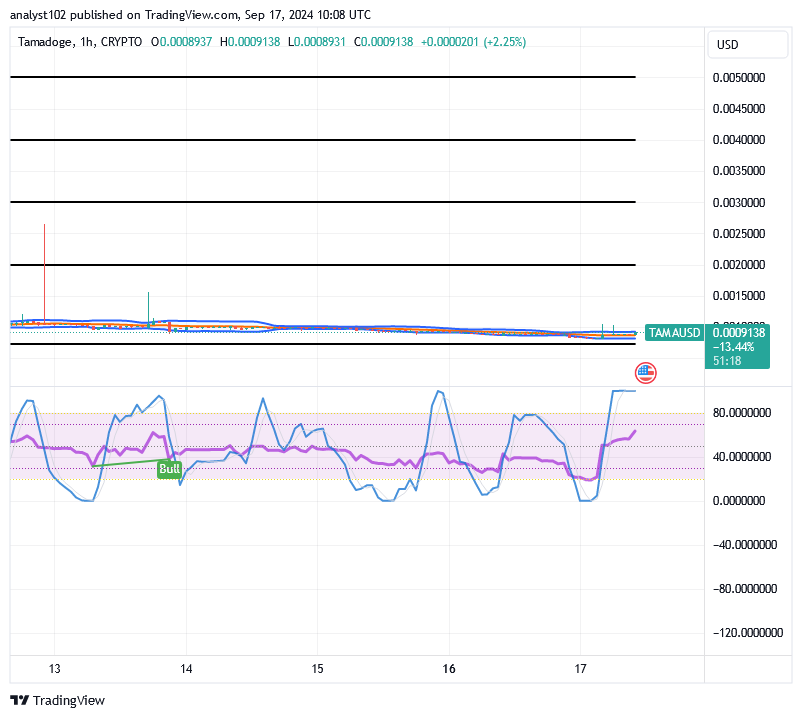
The TAMA/USD short-term chart shows that the crypto-economic price is expected to rise, retaining a base above $0.00075.
In order to determine the forces that the candlestick patterns have been adopting in response to price moves, the Bollinger Bands indicators have been extending their lines towards the east. Since the stochastic oscillators have entered the overbought area, buyers should exercise patience while placing new orders for the time being.
By the time the game ends, Pursuit will have transformed your pet into a pretzel!
Pursuit will have your pet looking like a pretzel by the time you finish playing! 😂 🥨 #Tamadoge #P2E pic.twitter.com/e5XQG4dwlS
— TAMADOGE (@Tamadogecoin) August 2, 2024
Do you want a coin that would 100X in the next few months? That is Tamadoge. Buy TAMA today
Note: Forexschoolonline.com is a financial advisor. Do your research before investing your funds in any financial asset or presented product or event. We are not responsible for your investing results.


Leave a Reply