Tamadoge Price Prediction – June 20
It appears that the crypto economy is still in the mode of looking for the lowest price since its introduction into emerging trade instruments, as the TAMA/USD market presently nurtures hikes in inputs, forming a base.
The trade line continues to be favorable for long-position takers to continue securing additional points ahead of typical rebounds, regardless of the stochastic oscillators’ current positional outlook, which is now near the overbought zone. Following that supposition, variant high-lines that were first bought shouldn’t be hastily sold off because it is still anticipated that there will be a significant long-term rebound afterward.
TAMA/USD Market
Key Levels
Resistance levels: $0.004, $0.006, $0.008
Support levels: $0.002, $0.0015, $0.001
TAMA/USD Medium-term Chart
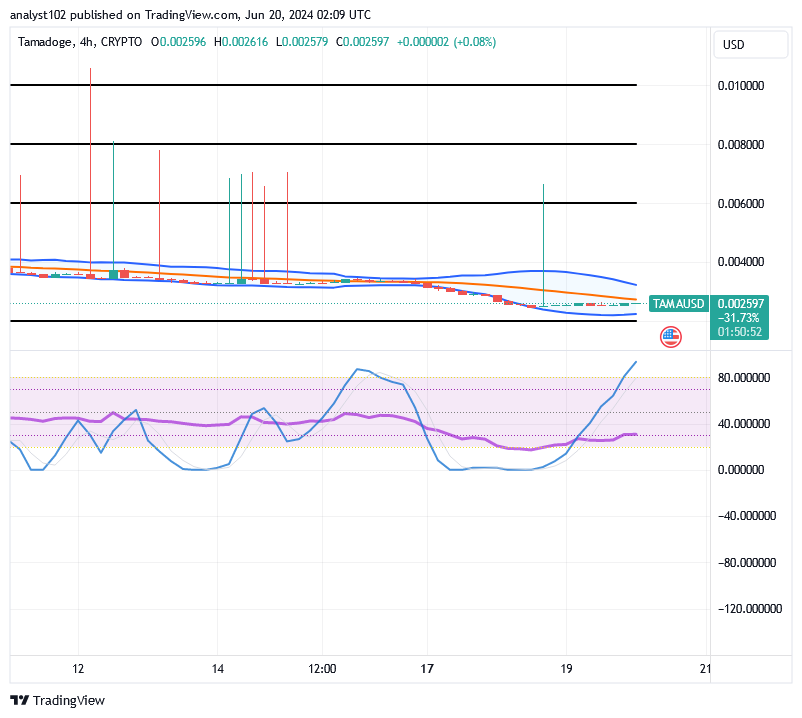
The TAMA/USD medium-term chart showcases that the crypto market is nurturing hikes, forming a base.
There is evidence to suggest that during price movements, the Bollinger Bands trend lines will tend to realign around the $0.004 and $0.002 marks. The stochastic oscillators are currently approaching the overbought area from the north.
When the TAMA/USD market oscillates between the middle and lower Bollinger Bands, should buyers stay off?
It would be among the best buying times to see the TAMA/USD market eventually oscillating between the middle and lower Bollinger Bands, given that the price now nurtures hikes, forming a base.
The stochastic oscillators’ current movement mode, which has achieved an overbought situation, makes it susceptible to producing a delay strategy aimed at gaining additional positioning points ahead of various upsurges. The route may quickly return to the north if the market line coupling is moved in an attempt to make a swift reversal motion.
The TAMA/USD short-term
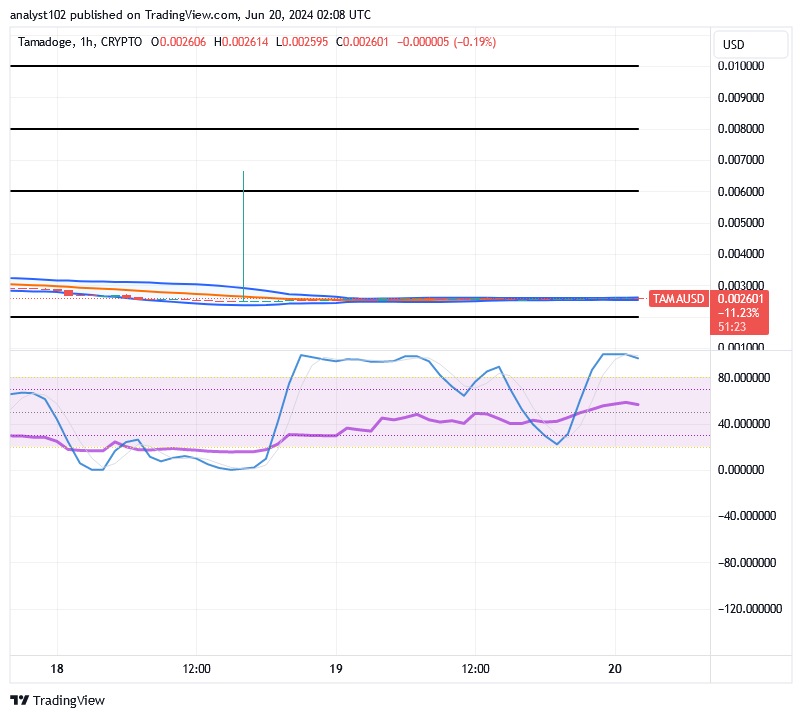
The TAMA/USD short-term chart showcases that the crypto instrument is nurturing hikes in indexes, forming a base.
The trend lines of Bollinger Bands have been constricting towards the east, designating the $0.003 zones as the primary resistance from an hourly technical standpoint. The overbought area where the stochastic oscillators are positioned indicates that buyers would need to hold off before putting in a buying order. For investors, though, the configuration suggests a strong buy signal.
The #Tamadoge leaderboard ends at midnight UTC this evening!
Tonight, make a difference and get some delicious
End of Week Competition Warning! ⚠️
— TAMADOGE (@Tamadogecoin) June 19, 2024
The #Tamadoge leaderboard closes tonight at midnight UTC! 🌟
Make the difference tonight and win some sweet $TAMA! 💰🍬
Download & Play:
📱 Android: https://t.co/D4TjX7gTFl
📱 iOS: https://t.co/0fjJapf5oA#CryptoGaming #DogeOrNothing #P2E pic.twitter.com/GUpkPPrSrC
Do you want a coin that would 100X in the next few months? That is Tamadoge. Buy TAMA today
Note: Forexschoolonline.com is a financial advisor. Do your research before investing your funds in any financial asset or presented product or event. We are not responsible for your investing results.


Leave a Reply