Tamadoge Price Prediction – May 18
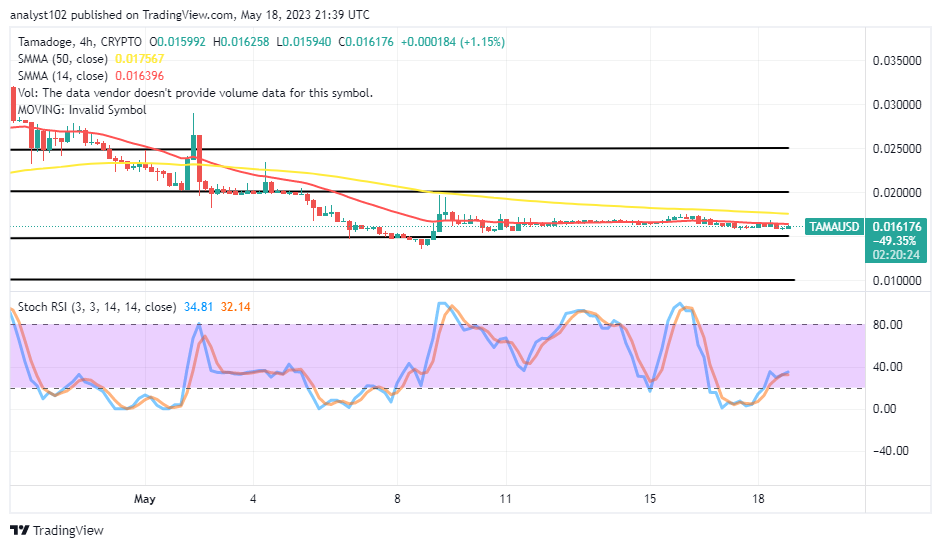
The TAMA/USD price moves eastward and looks for a bounce, maintaining trading spots between $0.015940 and $0.016258 values above the support line of $0.01500. As of the writing of this technical piece, the price’s percentage rate is 1.15 positives. We think long-position takers will tightly center their baseline-building procedure around the previously mentioned support point.
TAMA/USD Market
Key Levels
Resistance levels: $0.02000, $0.02250, $0.02500
Support levels: $0.01250, $0.01000, $0.00750
TAMA/USD – 4-hour Chart
The TAMA/USD 4-hour chart showcases the crypto-economic price moves eastward and looks for a bounce around the consolidated-moving eastward of the smaller SMA. The 50-day SMA indicator is at $0.017567 above the $0.016396 value line of the 14-day SMA indicator. The Stochastic Oscillators have been systemically swerving northbound from the oversold region to position at 32.14 and 34.81 levels, indicating a bullish signal is in the offing.
Do the TAMA/USD market activities appear to be reducing sustainably beyond the $0.01500 level?
As the TAMA/USD price swings eastward and searches for a bounce, certain over-left falling factors that are still in play could seek to push the price artificially past the $0.01500 support line. A loss of gravity to the downside below the current pace of the 14-day SMA trend line will allow bulls to muscle up the catalyst to nudge backings for subsequent upswings.
On the downside of the technical analysis, a sudden reversal motion against the 14-day SMA trend line may slowly accomplish in the wake of revisiting the $0.01500 support line. In the meantime, a resistance line is shielding a mark over the bears’ reactions around the point of the 50-day SMA trend line. However, if unprecedented breakout surfaces against those points, the presumed bounce will keep a long sustainable path into a mooning running afterward.
TAMA/USD 1-hour chart
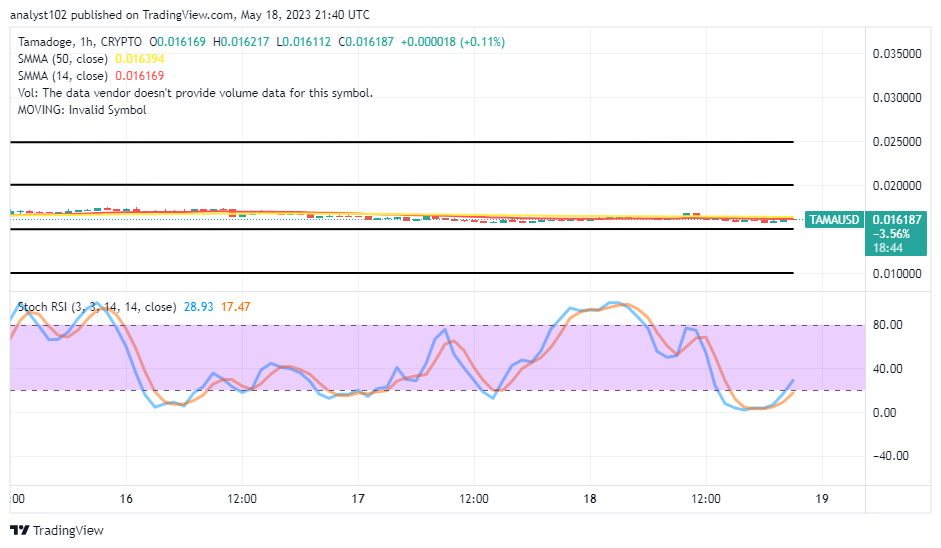
The TAMA/USD 1-hour chart showcases that the crypto-economic price moves eastward and looks for a bounce in a continual motion around the SMA trend lines. The 14-day SMA indicator and the 50-day SMA indicator have been trending eastward between the close points of $0.016169 and $0.016394. The Stochastic Oscillators have crossed northward from the oversold region to levels of 17.47 and 28.93, indicating that buyers are making an effort.
Forget about Babydoge, TAMA is winning! In the coming days, it will be listed on top CEXs.
Do you want a coin that would 100X in the next few months? That is Tamadoge. Buy TAMA today
Note: Forexschoolonline.com is not a financial advisor. Do your research before investing your funds in any financial asset or presented product or event. We are not responsible for your investing results.


Leave a Reply