Tamadoge Price Prediction – August 7
Tamadoge market may begin upsurge processes in a sequential moving order following finding a formidable base.
The trade activity in the TAMA/USD market operations up to this point has been predicted to extend the wage range of purchasing options from the scratch reduction spots. And because of the delay over time in the company even up to this point, that may trigger panic situations in the minds of traders with limited perspective, especially long-position takers. Our conclusion, which has never changed, is that plunging into a persistent trend will allow for buying opportunities at more ideal, lower prices at its conclusion.
TAMA/USD Market
Key Levels
Resistance levels: $0.01000, $0.01100, $0.01200
Support levels: $0.00900, $0.00800, $0.00700
TAMA/USD Medium-term Chart
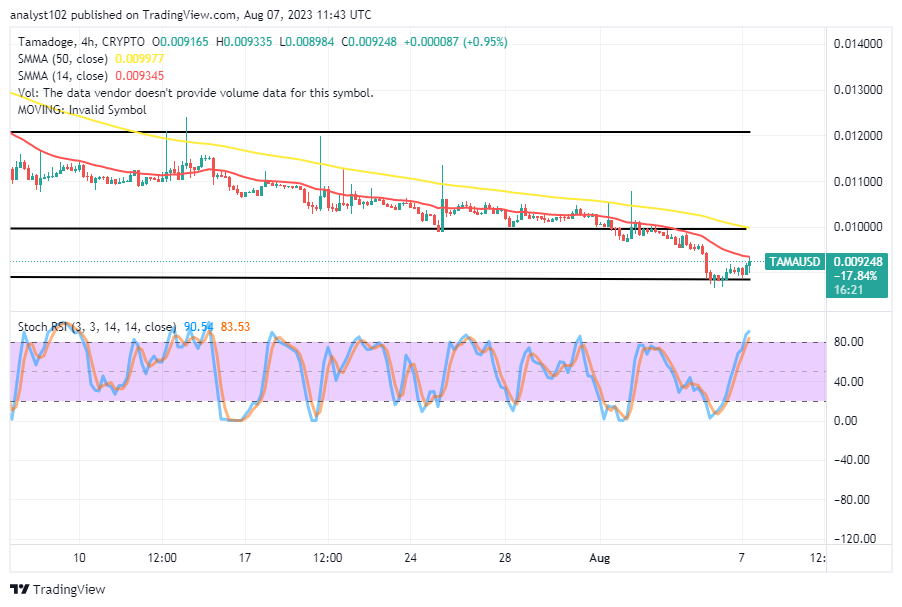
The TAMA/USD medium-term chart establishes that the crypto-economic price upsurges sequenced to a base formation around the level of $0.00900 about some hours ago.
Underneath the 50-day SMA indicator’s $0.009977 pivot point, the 14-day SMA indicator is at $0.009345. In order to demonstrate that pressure on the south side is now more effectively coming to an end, the smaller Moving Average has gained muscles and is bending tightly southward over candlesticks. The Stochastic Oscillators are moving in a northerly direction and staying between 83.53 and 90.54, which suggests that a degree of positive force is on the way.
In this kind of developing cryptocurrency industry, which is best to approach—investment methods or trading on platforms like MT4?
Without much ado, the investment trade approach remains the best approach while seeing dipping moves in a particular crypto economy at a given period, as even the TAMA/USD market has been taken to begin upsurges, leading to a base-building outlook at around $0.00900.
Every time the price has started to play along with a falling force below the SMA indications, buyers are to keep building up more money by buying from the lows. Long-position takers will initially have to contend with an undulating force that tends to develop between the smaller SMA and the support line of $0.00900 in the medium term of the running outlook.
TAMA/USD Short-term chart
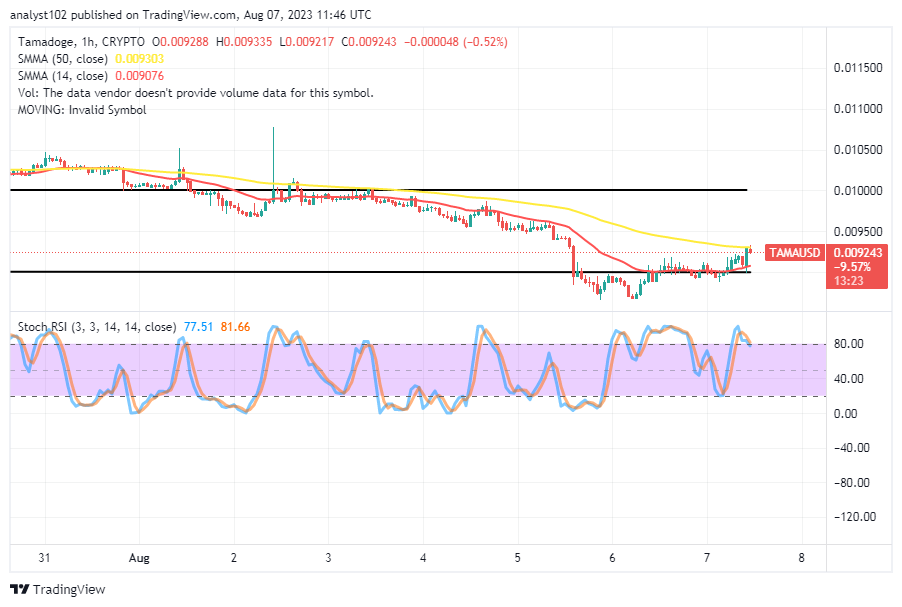
The TAMA/USD short-term chart showcases the crypto-economic price may begin upsurges, sequence to a base made around the trade zones of $0.00900 and $0.00850.
As it sits below the trend line of the 50-day SMA, the 14-day SMA trend line has been attempting to move northward from about $0.00900. The stochastic oscillators are attempting to cross southward to a position between 81.66 and 77.51 points while in the overbought area. It would be psychologically necessary to practice patience for some time before experimenting with additional purchasing methods.
Interact directly with our community leaders and the rest of the Tama Army while exchanging gaming advice.
💡Remember, joining our Telegram group gets you in on the action for news, giveaways and updates! 🤩
— TAMADOGE (@Tamadogecoin) August 7, 2023
Chat directly with our community leads and trade gaming tips with the rest of the Tama Army 👾💪
📱:https://t.co/yPpSTpMp1p pic.twitter.com/SOh3CakIg5
Do you want a coin that would 100X in the next few months? That is Tamadoge. Buy TAMA today
Note: Forexschoolonline.com is not a financial advisor. Do your research before investing your funds in any financial asset or presented product or event. We are not responsible for your investing results.


Leave a Reply