Tamadoge Price Prediction – May 16
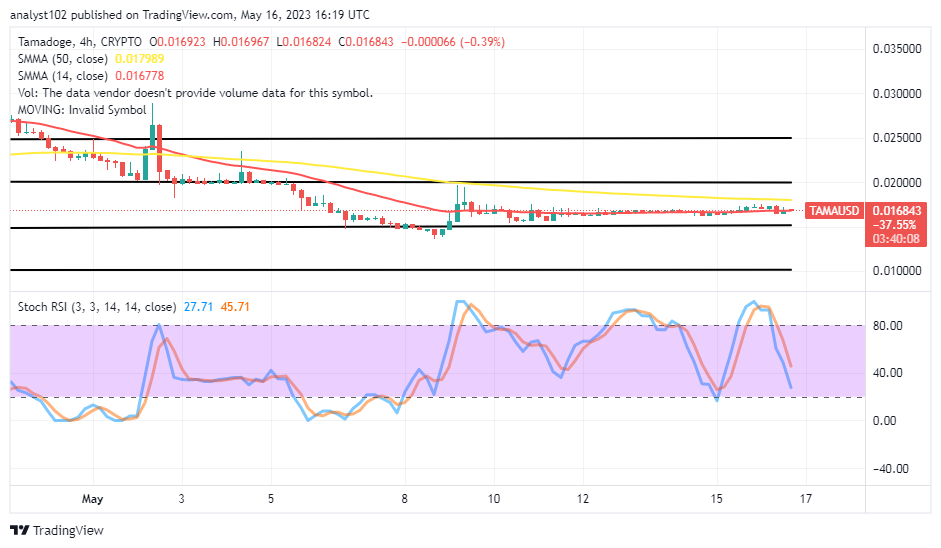
At the moment, it has been that the TAMA/USD market may be in long ranges before bouncing to the upside. Trading lines of $0.02000 and $0.01500 have continually demonstrated vital zones embodying the feeble pushes between buyers and sellers. In the meantime, it recalled that the US currency is creating a minute percentage impact at 0.39 as the price trades at $0.016843. Every indication backs the emerging crypto to still be at a point worthy of buying.
TAMA/USD Market
Key Levels
Resistance levels: $0.02000, $0.02250, $0.02500
Support levels: $0.01250, $0.01000, $0.00750
TAMA/USD – 4-hour Chart
The TAMA/USD 4-hour chart reveals the crypto-economic price may be in long ranges before bouncing back, as it overly featured around the trend line of the smaller SMA. The 14-day SMA indicator is at $0.016778, underneath the $0.017989 value line of the 50-day SMA indicator. The Stochastic Oscillators have crossed southbound from the overbought region to 45.71 and 27.71 levels. The situation suggests that a relative drop is in the card.
Will the TAMA/USD market operations lose stances around the 14-day SMA afterward for a better support line rebuilding?
Any attempt made by sellers to push the TAMA/USD market further below the 14-day SMA trend line from its current positioning of moving will lead to giving more better lower prices away from the long ranges before bouncing back to the upside in no time. Investors could cultivate the idea of buying or adding more to their portfolios, considering the crypto economy is still in one of the lowest reduced price zones.
Although there was a bearish trading signal, the sellers’ efforts in pushing the cryptocurrency market aren’t sufficiently encouraging to warrant a shorting order.. As a result, selling activities have to be on hold at the 14-day SMA trend line and the regions beneath it.
TAMA/USD 1-hour chart
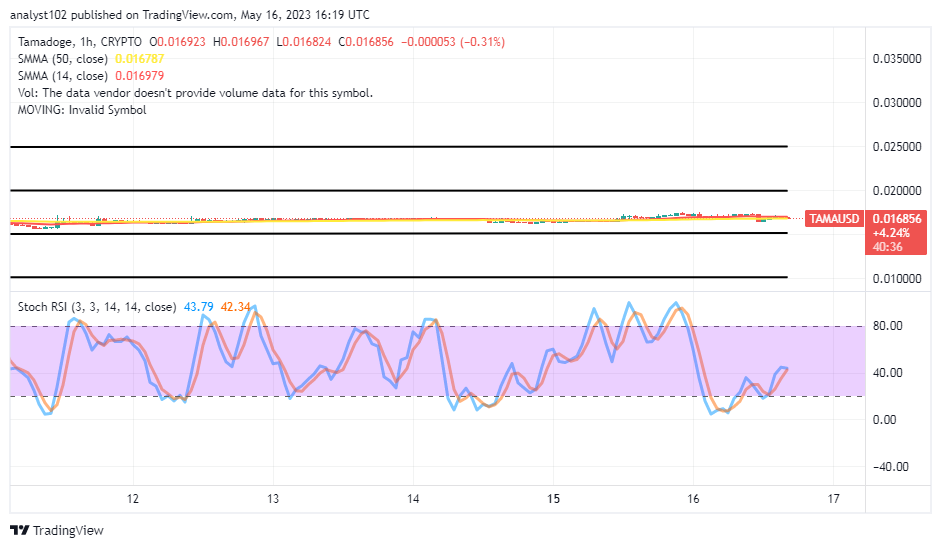
The TAMA/USD 1-hour chart showcases that the crypto-economic price may be in long ranges before bouncing back to the moon side. There has been continual tight contact between the 14-day SMA indicator and the 50-day SMA indicator, indicating that price features lower lows in a recessive format around them. The Stochastic Oscillators have been managing to swing northbound from the oversold region across some levels. And they are around 42.34 and 43.79, seemingly trying to close their lines to signify that a pause session will prevail.
Forget about Babydoge, TAMA is winning! In the coming days, it will be listed on top CEXs.
https://twitter.com/Tamadogecoin/status/1653374559079342080/photo/1
Do you want a coin that would 100X in the next few months? That is Tamadoge. Buy TAMA today
Note: Forexschoolonline.com is not a financial advisor. Do your research before investing your funds in any financial asset or presented product or event. We are not responsible for your investing results.


Leave a Reply