Tamadoge Price Prediction – October 27
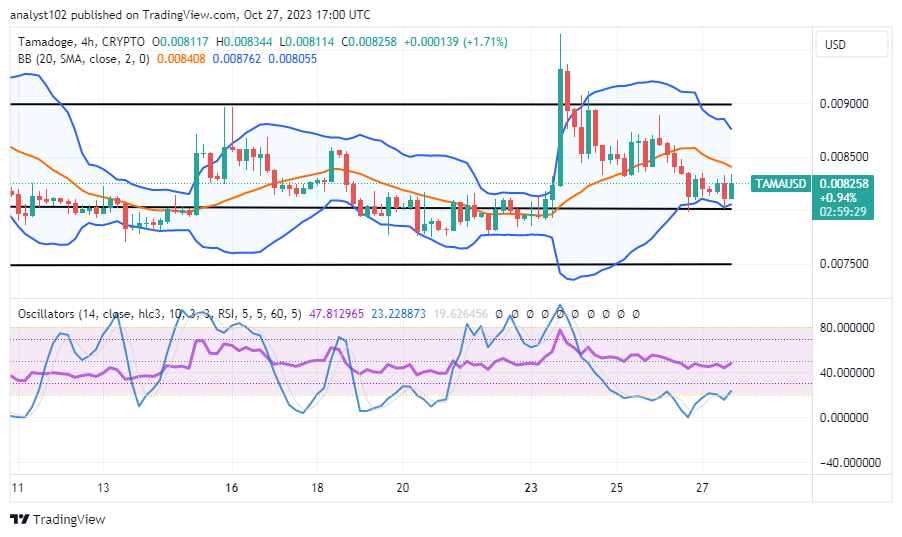
A near technical point of view has showcased that a line of slow and steady corrections has featured in the TAMA/USD market as the crypto price makes bottoms around the line of $0.00800, minding rises.
A series of 4-hour candlesticks has been seen throughout some hours of the most recent trading activity, indicating a mere falsehood of extending their presence beyond the crucial value of $0.00800. It may not be too long for long-position takers to surge northward from their current market point of $0.008258, as it has been closely studied. Prior to the significant anticipated bounces, investors should increase their efforts by adding more positions to their portfolio sizes.
TAMA/USD Market
Key Levels
Resistance levels: $0.00900, $0.009500, $0.01000
Support levels: $0.007500, $0.007000, $0.006500
TAMA/USD Medium-term Chart
The TAMA/USD medium-term chart showcases the crypto-economic price making bottoms around the crucial trade line of $0.00800, possibly in pursuance of any volatile movements that might soon show up.
The trending positional values of the Bollinger Bands’ trend lines are obtained from $0.008762, the middle part is at $0.008408, and the lower part is positioned at $0.008055, respectively. The stochastic oscillators are positioned from 47.812965 to 23.228873. They portend that a pause session is ongoing at a lower-trading spot.
As of the writing of this article, what trade status does the TAMA/USD market have?
At this time of this technical piece, the market relatively trends in ranges as the TAMA/USD market makes bottoms around the point of $0.00800, minding rises. As the price swings around the lower bound of the Bollinger Band trend line,
indicators from different angles point to sellers gradually losing out on positions. The rate at which they are attempting to create bottoms may quickly lead to convergence at the lower trading position. Purchasing options should take precedence over the opinions of other traders, regardless of the circumstances.
TAMA/USD Short-term chart
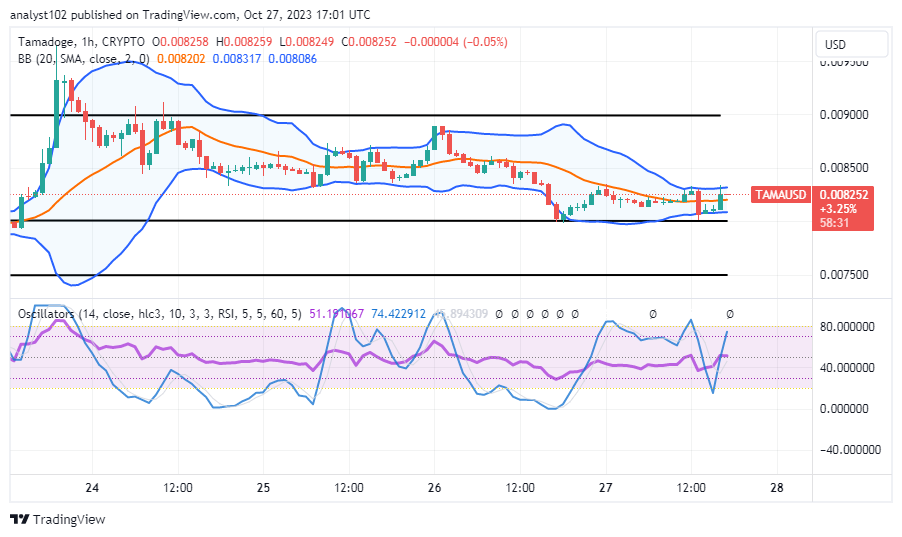
The TAMA/USD short-term chart showcases the crypto-economic trade-making bottoms, rising from the lower part of the Bollinger Band trend line.
The random oscillators have veered somewhat to the north, from locations 51.191067 to 74.422912. The Bollinger Bands have been proven to have values on an hourly basis ranging from $0.008317 to $0.008202, with $0.008086 serving as their bottom side. Overall, those that take short positions
With great pleasure, we announce the addition of our new pet store to the recently renovated Tamadoge Arena.
We’re pleased to announce that we’ve upgraded Tamadoge Arena to include our new Pet Store 🎉
— TAMADOGE (@Tamadogecoin) October 27, 2023
New Players get a free Puppy NFT and 20 free credits to play. Download now to check it out 👇
📱 Android: https://t.co/INCaGendE4
📱 iOS: https://t.co/Fj9tT5Oicu pic.twitter.com/AIAExGPEve
Do you want a coin that would 100X in the next few months? That is Tamadoge. Buy TAMA today
Note:Forexschoolonline.com is not a financial advisor. Do your research before investing your funds in any financial asset or presented product or event. We are not responsible for your investing results.


Leave a Reply