Tamadoge Price Prediction – July 21
Presently, it has been determined that the Tamadoge market operation maintains a foothold while taking less action to push forcibly against the US coin.
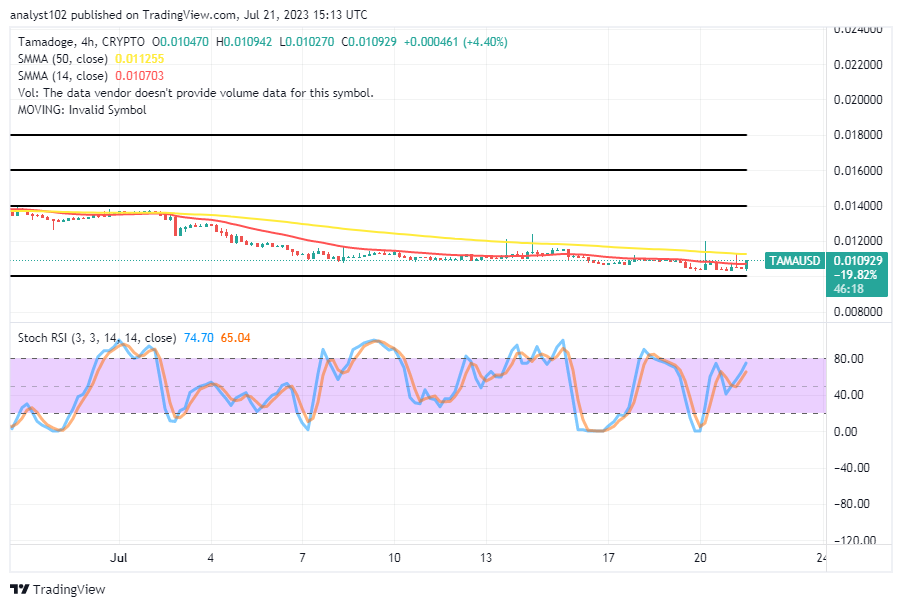
It has been seen that the valuation of the cryptocurrency economy is gaining the appropriate momentum, having moved systematically in a long-term running mode to a significant lower trading zone to foresee decent cycles for a number of buying positions. Currently, a significant percentage rate of 4.40 has been reached to assess the good trade capacity that purchasers have been recovering throughout today’s session, placing between $0.010942 and $0.010270. It means that the majority of any impulsive attempts to reverse the upward trend will be unsuccessful and will be directed toward the support line of $0.01000.
TAMA/USD Market
Key Levels
Resistance levels: $0.01200, $0.01400, $0.01600
Support levels: $0.01000, $0.00900, $0.00800
TAMA/USD – 4-hour Chart
The TAMA/USD 4-hour chart showcases that the crypto-economic price maintains a foothold, taking less action to surge fearfully higher past the trend line of the bigger indicator.
In recent times, variable candlesticks have pushed up and down around the trend lines of the SMAs. The positioning of the 14-day SMA trend line is at $0.010703 underneath the $0.011255 point of the 50-day SMA trend line. And they are yet to cross back to the north side to indicate that the clarity index is running upward. The Stochastic Oscillators have been poised between 65.04 and 74.70.
Will the TAMA/USD market soon show a likely indicator of a break below the $0.0100 support line?
As it has been long observed, there might not be a sudden decline in the valuation of the TAMA/USD price beyond the critical support point of $0.0100 in the near future, given that the crypto coin maintains a foothold closely above it, taking less action toward bouncing aggressively at the moment.
It has just been playing out that most position entry orders will carry positive results rather than the opposite outcome, even in the near future. In light of that assumption, buyers are to be optimistic by adding or leaving previous long positions that might have been opened in the past to run. Investors are better positioned to enjoy the upward movement in this market in the long run.
TAMA/USD 1-hour chart
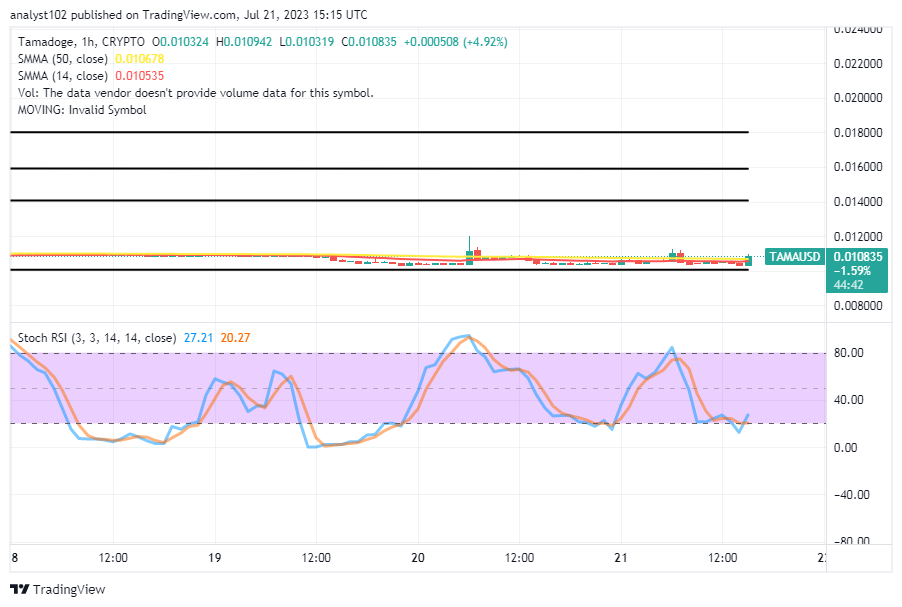
The TAMA/USD 1-hour chart reveals the crypto-economic price maintains a foothold, taking less action in its rebounding motion style away from the support level of $0.01000 at the beginning of this technical piece.
The 14-day SMA trend line has been clogging alongside the trend line of the 50-day SMA. And they are a bit above the value of $0.01000 support. The base trading instrument is attempting to push back for recoveries, and the stochastic oscillators have moved south from 20.27 to 27.21 values to indicate that they are trying to cross back northbound.
Tama Tom, our community manager, has all the most recent information about our new games, NFTs, and more!
🗞️ Weekly Tamadoge Update 🗞️
— TAMADOGE (@Tamadogecoin) July 21, 2023
Community Manager, Tama Tom, has all the updates about our newest games, NFTs and more!
Get your fix now ▶️ pic.twitter.com/Bl6GyZ7x3n
Do you want a coin that would 100X in the next few months? That is Tamadoge. Buy TAMA today
Note: Forexschoolonline.com is not a financial advisor. Do your research before investing your funds in any financial asset or presented product or event. We are not responsible for your investing results.


Leave a Reply