Tamadoge Price Prediction – October 23
The impulse of trade actions has been slowing down at lower-trading zones, given that the TAMA/USD market is uprising, based on a threshold above the support line of $0.007500.
Before anticipated rising trading sessions that are anticipated to be coming up, buyers appear to be loading their muscles toward playing alongside variation increases along trade lines between the points of $0.00800 and $0.007500. Given that assumption, continuing orders for long positions must be made without worrying about losing out because the market is still underpriced.
TAMA/USD Market
Key Levels
Resistance levels: $0.008500, $0.009000, $0.009500
Support levels: $0.007500, $0.007000, $0.006500
TAMA/USD Medium-term Chart
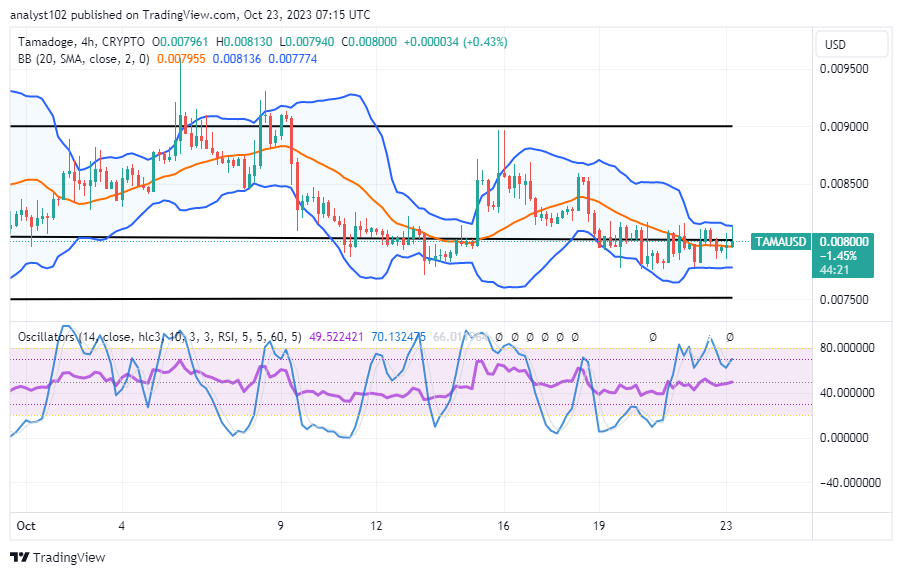
The TAMA/USD medium-term chart mirrors that the crypto’s price is uprising even within the confinement of the Bollinger Bands, based on a threshold.
The trend lines of the Bollinger Band are positioned at $0.008136, $0.007955, and $0.007774, respectively. The stochastic oscillators are placed northbound from 49.522421 to 70.132475 points. As it is, the lower part of the Bollinger Band will serve as the key underlying support trade area against getting more stable declines if there are corrections afterward from the present market line.
What speed gait are the TAMA/USD market buyers currently putting up with in reference to the trading indicators?
There have been a series of lower lows, retarding the presence of bulls around the variant trend lines of the Bollinger Bands, given that the TAMA/USD trade is uprising, based on a threshold above the support level of $0.007500.
It has been established that some forces that support upward movements are likely to continue for a while before beginning to increase from a lower point. Because expectations have grown that an explosive breakout will occur in the near future, bears should exercise caution when opening positions around the trend line of the upper Bollinger Band. Before the following northward hiking motions, gravitational forces will be waiting to collect catalysts.
TAMA/USD Short-term chart
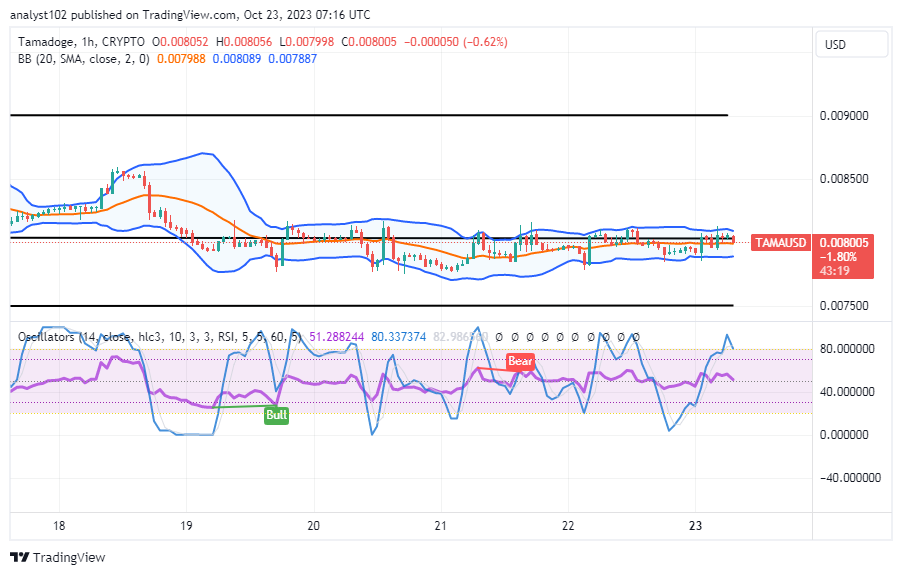
The TAMA/USD short-term chart showcases the crypto trade uprising in the trending zones of the Bollinger Bands, basing a threshold above the critical support figure of $0.007500.
Between the significant points of $0.00800 and $0.007500, the Bollinger Band trend lines have been extending easterly, denoting resistance and support levels from the present trading perspective. The stochastic oscillators continue to oscillate in the range of 51.288244 and 80.337374. A smaller bearish candlestick has been forming as a warning indication for smooth upsurges from the area around the upper Bollinger Band. But investors are expected to manage their positions by long-term buying and holding inside and near the indicators’ points.
Coming up on Halloween, we’ll be burning 10 million TAMA to add some more fire to the celebrations.
Halloween is just around the corner and we’re adding some extra fire to the festivities by burning 10 Million $TAMA!
— TAMADOGE (@Tamadogecoin) October 22, 2023
Keep track of our first big burn of the year here 👉 https://t.co/CweV78gM4h 🎃🔥 pic.twitter.com/ulH8ploBs3
Do you want a coin that would 100X in the next few months? That is Tamadoge. Buy TAMA today
Note:Forexschoolonline.com is not a financial advisor. Do your research before investing your funds in any financial asset or presented product or event. We are not responsible for your investing results.


Leave a Reply