Tamadoge Price Prediction – May 31
It has been overly observed that buyers in the market operations of Tamadoge versus the US currency have been trying to get a reliable support zone, as the present financial situation has it that the price is spiraling; keeping a base above $0.003.
Though the market hasn’t yet retreated into more obvious positive patterns that could drive further gains to higher levels, the current state of affairs prevents sellers from making easy inroads into any potential crypto signal that might emerge while a reversal of an upward trend is plausible, particularly from around $0.006 and its lower values. If that has to be technical sentiment to go by, accumulation of points has to continue before the occurrence of stable upsurges above the value line.
TAMA/USD Market
Key Levels
Resistance levels: $0.006, $0.007, $0.008
Support levels: $0.0035, $0.003, $0.0025
TAMA/USD Medium-term Chart
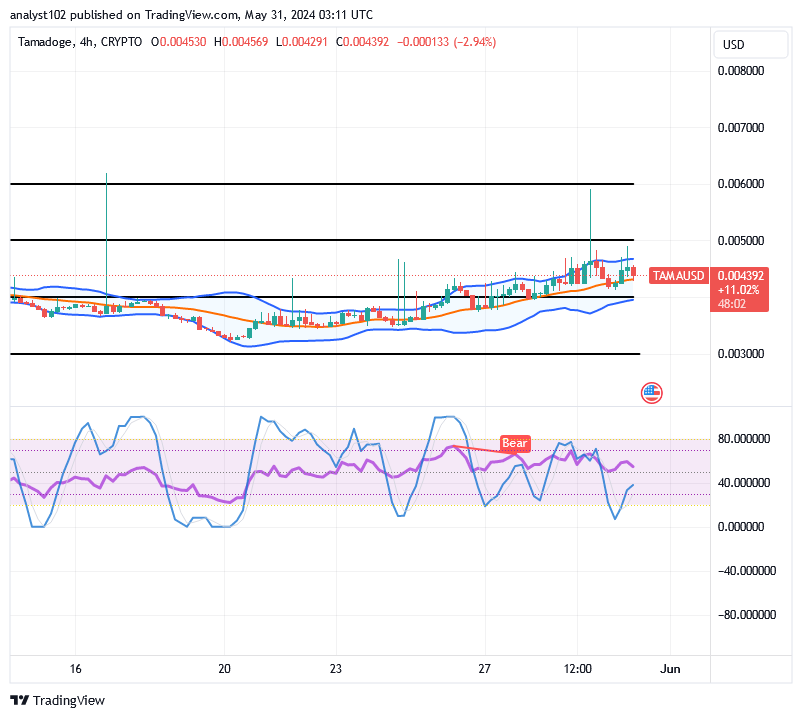
The TAMA/USD medium-term chart reveals that the crypto market has been spiraling; keeping a base above $0.003.
The Bollinger Bands have been moving slightly to the north, containing the majority of price movements within the upper and middle section borders. The bottom side remains the crucial instrument for monitoring any instances of abrupt and frightening declines, should they need to occur. Right now, the stochastic oscillators are circling 40, suggesting that a fall move may be imminent.
Which area of the Bollinger Bands should be given the greatest weight when determining which entry to trust in the TAMA/USD market?
Traders aiming for pushes alongside to the upward direction in the TAMA/USD market have to be vigilant of making a comeback around the middle Bollinger Band trend line or between it and the lower side while a positive move is tenable, given that the price has been seen to be spiraling and keeping a base above $0.003.
Longing of position orders have to be strategically carried out within and around the trending lines of the indicators of Bollinger bands in the meantime since they are yet to traverse beyond the resistance line of $0.006. Therefore, the only thing that purchasers would need to be aware of is over leverages.
The TAMA/USD short-term
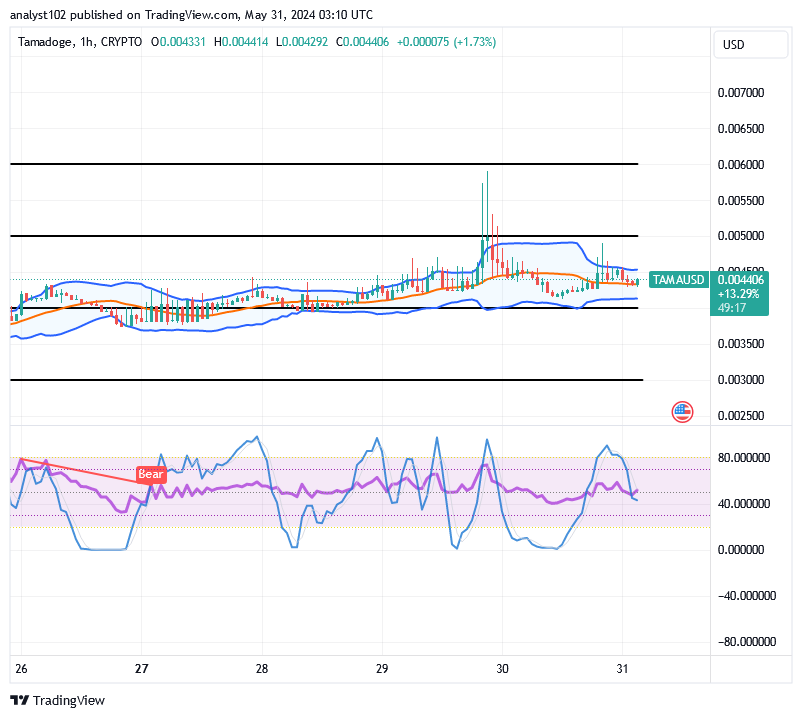
The TAMA/USD short-term chart shows that the crypto economy has been spiraling; keeping a base above $0.003.
The stochastic oscillators have seen, attempting to cross back northbound around 40 on the formation of a smaller bullish candlestick in the making. Looking at the 1-hour trade chart, the Bollinger Bands indicators are evenly placed within the points of $0.005 and $0.0035. Most signs are of more positive than relying on the thought of plummeting the crypto’s values in the ensuing operations.
There’s so much variation in the Tamaverse!
Do you prefer caring for and improving your Tamadogi, or are you all about the fast-paced action in the #Tamadoge Pursuit?
The Tamaverse is full of variety! 💥
— TAMADOGE (@Tamadogecoin) May 31, 2024
Are you all about the fast-paced action in #Tamadoge Pursuit, or do you prefer nurturing and upgrading your Tamadogi? 🏃♀️ 🐶
Drop a comment below and let us know your favorite game! 👇#CryptoGaming #DogeOrNothing #P2E pic.twitter.com/ibxT95KxSC
Do you want a coin that would 100X in the next few months? That is Tamadoge. Buy TAMA today
Note: Forexschoolonline.com it a financial advisor. Do your research before investing your funds in any financial asset or presented product or event. We are not responsible for your investing results.


Leave a Reply