Tamadoge Price Prediction – May 5
There has been an elongation of tendering price actions by bulls against the last effects that bears have made in the TAMA/USD market activities, as the current exchanging situation shows that the crypto moves slowly, possessing hike signs.
The capacity that short-position pushers have been holding excessively has now had to be decimated as the price is heading toward the $0.004 support line. It is important for investors to have a positive outlook, believing that a long-term holdings system will enable them to optimize the majority of positions launched at higher prices, even if the moves quickly become more aggressive.
TAMA/USD Market
Key Levels
Resistance levels: $0.006, $0.007, $0.008
Support levels: $0.004, $0.0035, $0.003
TAMA/USD Medium-term Chart
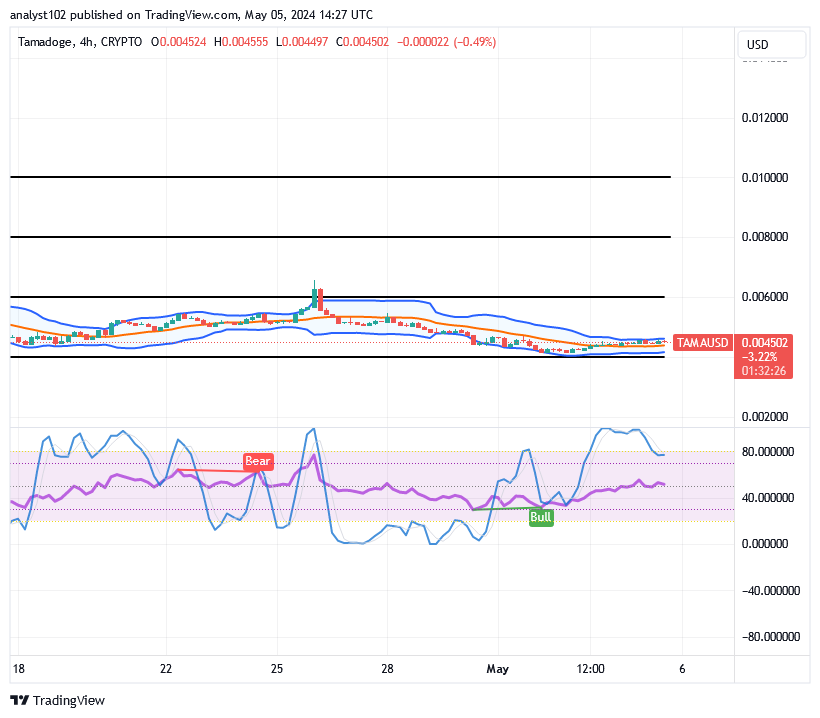
The TAMA/USD medium-term chart showcases that the crypto-economic market moves slowly, possessing hike signs.
The stochastic oscillators have remained traversing most times through variant points to the northbound. Additionally, they are now indicating that the market may be considering holding a halt session by positioning the blue section in the overbought area. Bollinger Band trend lines are seen to be tightly spaced between $0.005 and $0.004 points. This indicates that in the next activities, trade lines will either break upward or continue to drop around the lesser point.
Is it technically okay to see the TAMA/USD market moving lowly into other fresh lower zones below $0.004 soon?
From most of the angles at a higher time frame than the daily, it shows that so much energy to the downside has been utilized, as the TAMA/USD market presently moves slowly, possessing hike signs.
The trade line around $0.004 is expected to be a crucial zone that will, in the long term, withstand additional declines, as shown by the Bollinger Band trend lines at their lowest point. Following that presumption, additional yearning position commands must be added without risk of being lost in the aftermath of several sluggish steps that may still need to be taken in order to prevent steady climbs.
The TAMA/USD short-term
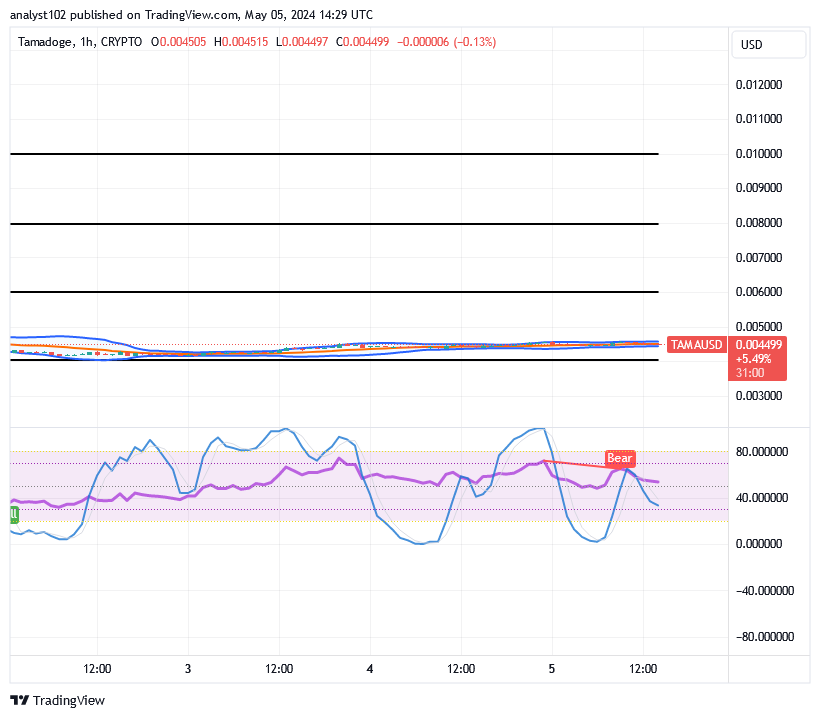
The TAMA/USD short-term chart showcases that the crypto-economic market moves slowly, possessing hike signs.
The Bollinger Bands indicators have remained within the $0.006 and $0.004 areas, continuing their eastward movement. The candlesticks have consistently shown varying degrees of hesitancy. The blue portion has been oriented southward by the stochastic oscillators, and it is now marginally near the 20-point.
Boost your Tamadoge’s performance with these special upgrades:
🧠 Intelligence
🏃 Agility
💪 Strength
🔥 Take control of the leaderboards by making your #NFT the best doge in the Tamaverse!
🐾 The #Tamadoge Pet Store!
— TAMADOGE (@Tamadogecoin) May 5, 2024
Elevate your Tamadoge’s abilities with exclusive upgrades:
🧠 Intelligence
🏃 Agility
💪 Strength
🔥 Make your #NFT the top doge in the Tamaverse and dominate the leaderboards!
Visit the Pet Store: https://t.co/loHQ4OPMUd
#CryptoGaming #P2E $TAMA pic.twitter.com/0hBECuqZYG
Do you want a coin that would 100X in the next few months? That is Tamadoge. Buy TAMA today
Note: Forexschoolonline.com it a financial advisor. Do your research before investing your funds in any financial asset or presented product or event. We are not responsible for your investing results.


Leave a Reply