Tamadoge Price Prediction, April 18
The price journey in its style to the downside has been showcasing to be gradually responding in negation mode, as the situation currently has it that the TAMA/USD market is rising above the point of $0.004, pulling up muscles with much promissory recovery signals.
It has been sufficiently proven for a long time that the Tamadoge’s market actions against the US Dollar are not free to continue their depleting movements past the $0.004 support level. Furthermore, that location has served as the lower bound to the pivotal resistance of $0.006, establishing trading ranges that buyers can never play with and the potential to stage multiple comebacks.
TAMA/USD Market
Key Levels
Resistance levels: $0.006, $0.008, $0.010
Support levels: $0.004, $0.003, $0.002
TAMA/USD Medium-term Chart
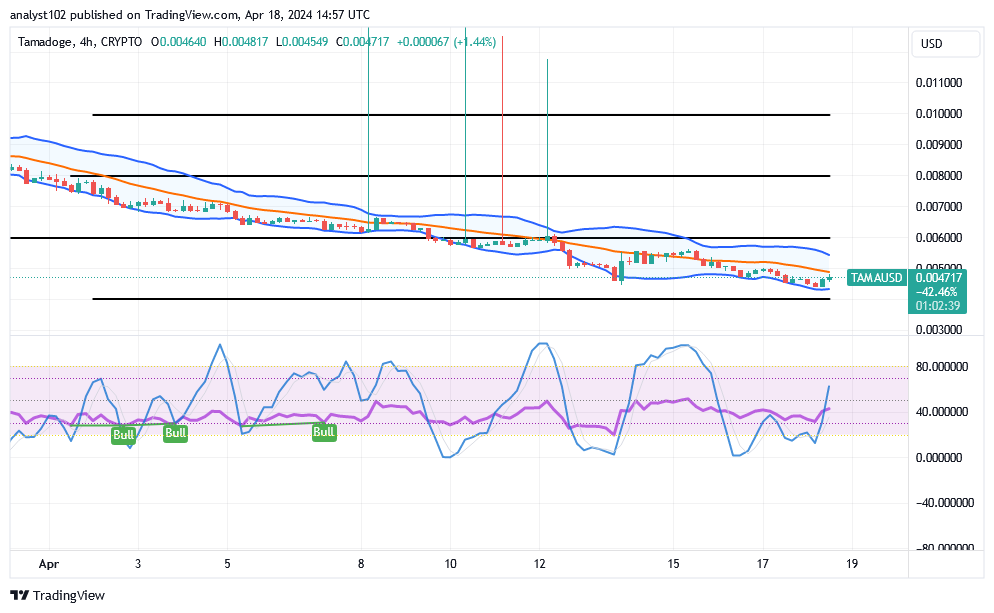
The TAMA/USD medium-term chart reveals that the crypto-economic market is presently rising, pulling up muscles toward the barrier spot of $0.006.
The Bollinger Band trend lines have stylishly remained tentatively moving to the southbound within the points of $0.006 and $0.004. The stochastic oscillators have been trying to maintain a perfect mood to the upside at some points.
Should pushers of long positions continue to purchase in the TAMA/USD market below $0.006 from a technical standpoint?
It is a rare opportunity for buyers to stake in the market operations of Tamadoge against the fiat American currency below the point of $0.006, given that the crypto economy is currently rising, pulling up muscles toward the value line.
Following a long-awaited rational outlook of receiving strong increases in crypto signals, the current favorable movements have partially restored the trade’s upward momentum. It has been observed that the majority of immediate buying orders that are completed at rates higher than the current zone may eventually see some appreciation. Therefore, regardless of the state of the market, buyers are cautioned against panic sales.
TAMA/USD Short-term Chart
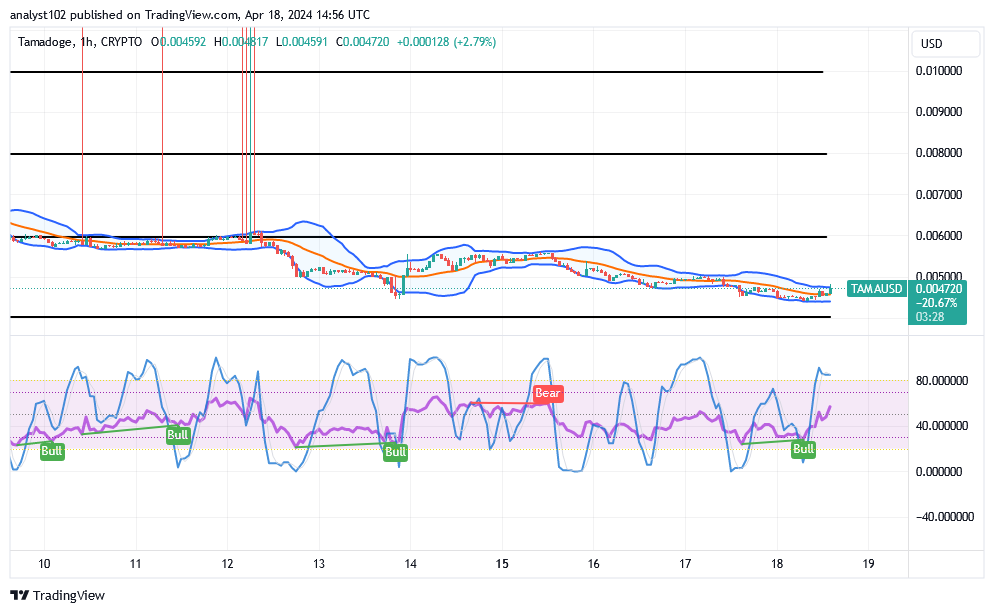
The TAMA/USD short-term chart showcases that the crypto trade is rising, pulling up muscles against the upper Bollinger Band’s zone.
Based on an hourly plan at a specific period in time, the stochastic oscillators are in the overbought region, indicating that some momentum has been depleted. The Bollinger Band signs point southerly in a systemic manner. Additionally, they are creating the crucial resistance zones that the price must tremble through in order to start rising again.
In preparation for Pursuit’s premiere, we’re adding extra spice to the leaderboards.
The top player on the high scoreboard each day will receive $100 worth of TAMA for the following seven days.
We’re making the leaderboards extra spicy for the launch of Pursuit 🌶️
— TAMADOGE (@Tamadogecoin) April 19, 2024
For the next seven days, the daily top player on the High Score leaderboard gets an $100 worth of $TAMA 💰
Get running 👇
Android: https://t.co/Of8SYALRzL
iOS: https://t.co/IthvqovwAH pic.twitter.com/VaBoqm3tWq
Do you want a coin that would 100X in the next few months? That is Tamadoge. Buy TAMA today
Note: Forexschoolonline.com is not a financial advisor. Do your research before investing your funds in any financial asset or presented product or event. We are not responsible for your investing results.


Leave a Reply