Tamadoge Price Prediction, March 2
The long-awaited presumed stable increases have been gradually showcasing in the market operations that combine Tamadoge with the market weight of the US coin, as the financial record currently shows that it is rising, holding up hike indexes.
It is becoming increasingly clear that the majority of underlying supports, which are essentially located from $0.005 downward, will not serve as long-term bargaining grounds for bears. Daily engulfing bullish candlesticks that emerge from lower trading areas may not exhibit smooth reversal motion, which could invalidate a surfacing base.
TAMA/USD Market
Key Levels
Resistance levels: $0.0080, $0.0090, $0.010
Support levels: $0.0055, $0.0045, $0.0035
TAMA/USD Medium-term Chart
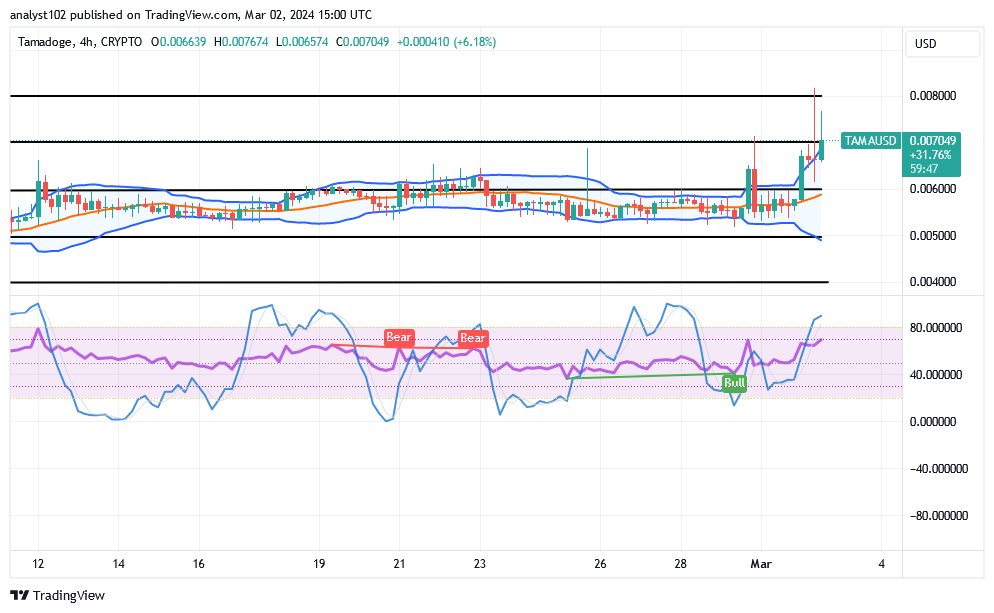
The TAMA/USD medium-term chart revels that the crypto-economic price is rising, holding index hikes in common.
The trade pathway to the moon has majorly started to garner a series of bullish candlesticks from the middle Bollinger Band trend line back to the upside of the upper Bollinger Band trend line to indicate that movements to the north are going to stage firmly soon. While in the process of that assumption materializing, the stochastic oscillators will most likely run a consolidation mode.
In the TAMA/USD market, should investors be concerned about a price reversal action near $0.008?
As there have been some attempts in the TAMA/USD market operations showing that ups and downs have been between $0.007 and $0.008, this should not be a signal to suggest a necessary pulling-out situation for bulls, given that the price has been observed to be rising, holding indexes.
The only need for the current trading strategy is for traders to be more optimistic than to take into account any other directional trend. In that scenario, sellers are generally prohibited from initiating counter-order positions, even in situations where the price tends to correct itself. It makes sense to speculate about a big explosion.
TAMA/USD short-term chart
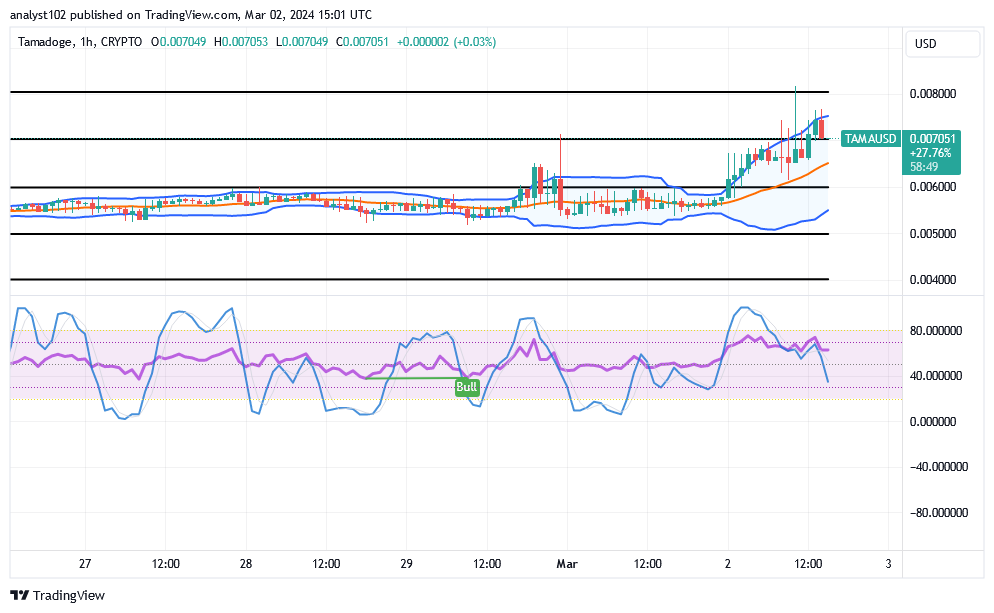
The TAMA/USD short-term chart is showcasing that the crypto trade is rising; holding hikes indexes along the path of the upper Bollinger Band.
Moves to the negative side are ongoing because the stochastic oscillators are trending slightly downward. The Bollinger Band trend lines have indicated that a line of gains is going to succumb to re-occurences by opening up a significant amount of trading space from the lower zones to the upside.
Enjoy the excitement of our free-to-play Tamagotchi-style app, where taking care of your own cute pet can earn you TAMA!
Dive into the fun of our free-to-play Tamagotchi-style app where you can earn $TAMA by caring for your own adorable pet!
— TAMADOGE (@Tamadogecoin) February 29, 2024
Download Tamadogi on Android & iOS now to start earning 👇
📱 Android: https://t.co/RfZIZOLaNJ
📱 iOS: https://t.co/du3iReizS4 pic.twitter.com/gFxppuh3sI
Do you want a coin that would 100X in the next few months? That is Tamadoge. Buy TAMA today
Note: Forexschoolonline.com is not a financial advisor. Do your research before investing your funds in any financial asset or presented product or event. We are not responsible for your investing results.


Leave a Reply