Tamadoge Price Prediction – August 27
Predominantly, a chain of sideways has featured in the method that Tamadoge has been trading against the valuation of the US Dollar, as the situation portends that the crypto-economic price may go receding for some time, making a rise in the long run.
Below the barriers of about $0.001000, the expected receding state might be well established. A brief glance at the daily technical analysis shows that the likely trading force is to push through additional notable resistance values while taking a chance on a risky positive outcome. Consequently, placing long positions and investing may require patience while waiting for volatile moves to manifest.
TAMA/USD Market
Key Levels
Resistance levels: $0.009500, $0.01000, $0.01050
Support levels: $0.007500, $0.006500, $0.005500
TAMA/USD Medium-term Chart
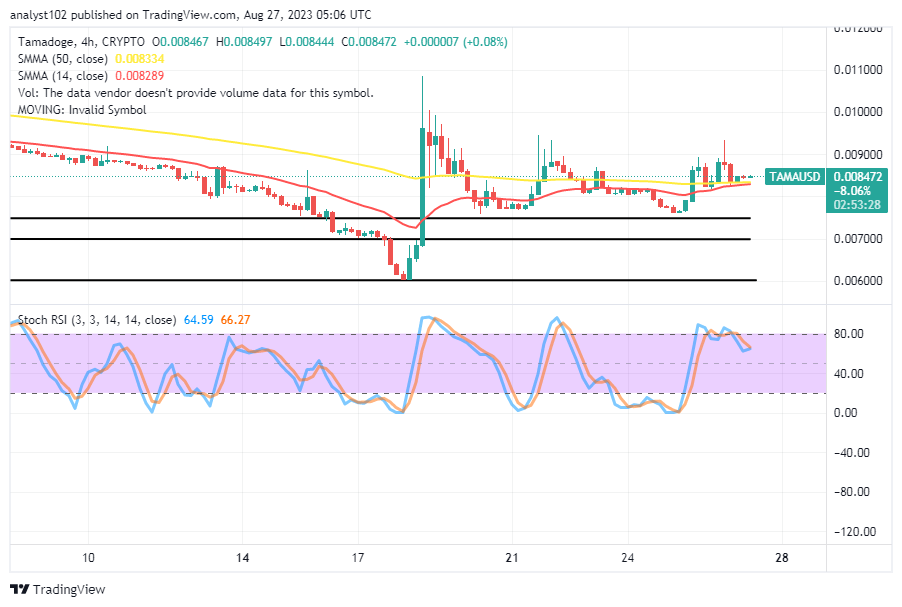
The TAMA/USD medium-term chart reveals the crypto-economic price is receding, making a rise from around the trend lines of moving averages.
Still there in the indicators’ positional arrangement is a depression trace. The 50-day SMA trend line is $0.008334 above the 14-day SMA trend line, which is $0.008289. The stochastic oscillators have moved slightly southward from 66.27 to 64.59 after sitting in the overbought area. They are now working to close their lines.
What does the current posture of the SMAs indicate about the TAMA/USD valuation?
At this present moment, the placement posture of the moving averages signifies that a lot of energy-mustering moments will possibly take effect to fuel more pushes through the resistances, given that Tamadoge price is receding against the USD and the market is also making a rise.
The most demeaning area among the important underlying support lines identified is $0.006000, which, if it eventually breaks completely, might lead to another series of decreasing zones in the coming days. The 4-hourly trade chart may subsequently reverse to retest the area near the $0.007500 support line in an effort to correct swinging gains.
TAMA/USD Short-term chart
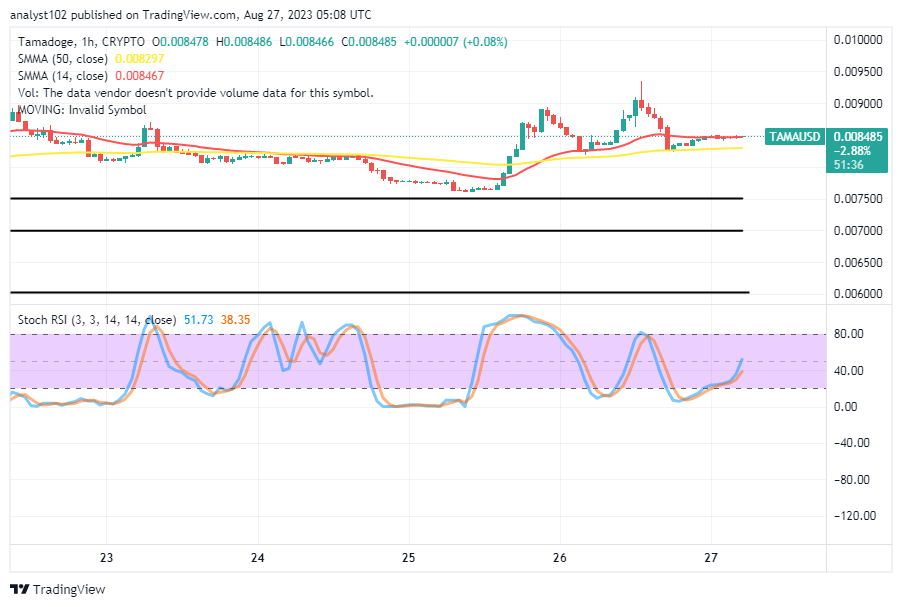
The TAMA/USD short-term chart shows that the crypto-economic market is receding in slow motion, signaling that the US economy is on the rise.
The 14-day SMA indicator is at $0.008467, very barely above the 50-day SMA indicator’s $0.008297 position. A series of upward-pointing bullish candlesticks developed, reaching a resistance level just below $0.009500. The stochastic oscillators have been positioned between 38.35 and 51.73 points, slowly and steadily rising north from the oversold area. A one-hour buying binge is in progress to indicate that the good vibes are still present.
Post a picture of your favorite dog below.
🐶 Happy #NationalDogDay Tama Army! Drop an image of your favourite pooch below 👇 pic.twitter.com/xisx1nNd6B
— TAMADOGE (@Tamadogecoin) August 26, 2023
Do you want a coin that would 100X in the next few months? That is Tamadoge. Buy TAMA today
Note: Forexschoolonline.com is not a financial advisor. Do your research before investing your funds in any financial asset or presented product or event. We are not responsible for your investing results.


Leave a Reply