Tamadoge Price Prediction – June 8
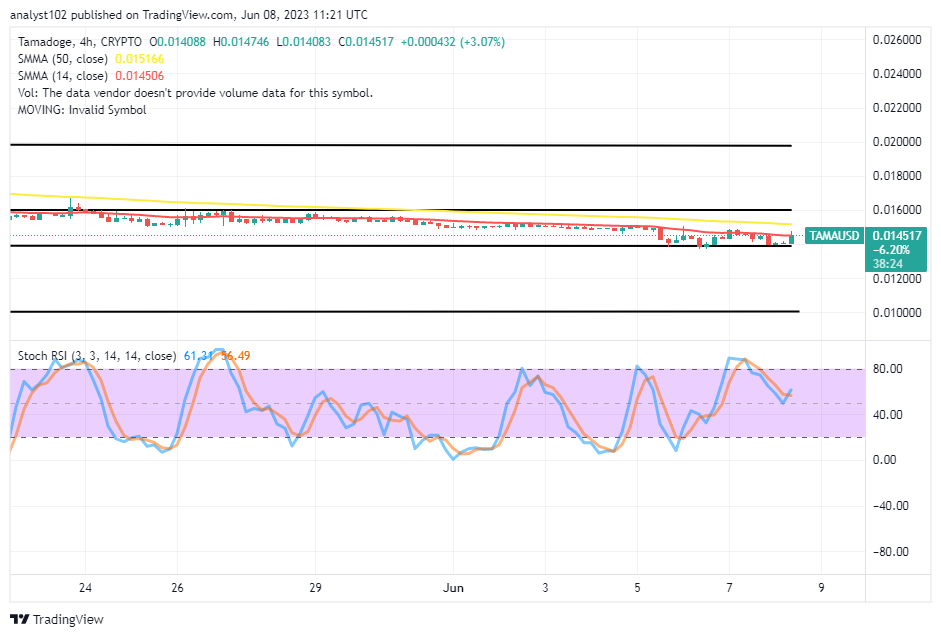
Sequence to the sessions that have produced variant bottoming outlooks around the support line of $0.01400 in the TAMA/USD market operation, the crypto’s price is currently pushing upwards to break resistance that has overlaid around the point of $0.01600. The market has been trading from a low-value line of $0.014083 to a high of $0.014746, averaging a percentage rate of 3.07 positive. Psychological experts have predicted that the range between $0.01400 and $0.01600 will consistently be suitable buying points to construct a long-term crypto investing portfolio.
TAMA/USD Market
Key Levels
Resistance levels: $0.01600, $0.01700, $0.01800
Support levels: $0.01400, $0.01300, $0.01200
TAMA/USD – 4-hour Chart
The TAMA/USD 4-hour chart showcases the crypto-economic price is pushing upwards to break resistance beyond the buy signal side of the smaller SMA. The 14-day SMA indicator is at $0.014506, slightly below the $0.015166 value line of the 50-day SMA indicator. The Stochastic Oscillators have prepared to move northward, from around 50 to 56.49 and 61.3 levels. The positioning of the Oscillators possesses a promising index to secure further rises.
What is the pivotal point to the current upward pushes in the TAMA/USD trade activities?
The critical trading level in response to the present upward pushes in the Tamadoge trade operations against the US currency is situated around the $0.01400 support line, establishing that the crypto-economic price is pushing upwards to break resistance toward the psychological line of $0.01600. As of this write-up, a 4-hour bullish trading candlestick in the making needed to finish with a full-body outlook to propel the next risings to uphold the trend further to the moon side. Another side trade approach toward achieving; increasing values is that the 14-day SMA’s points have to be traded past without allowing a reversal.
TAMA/USD 1-hour chart
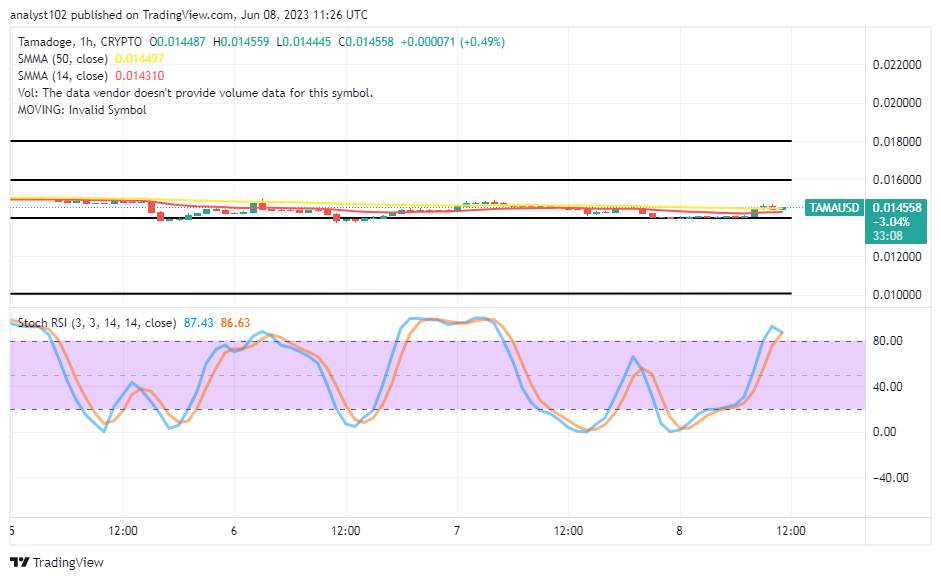
The 1-hour chart showcases that the crypto-economic price is pushing upwards to break resistance after being unable to put for long under a depression setting. The 14-day SMA trend line and the 50-day SMA trend line are placed closely under a resistance line of $0.014500. The Stochastic Oscillators have shifted northbound into the overbought region. Additionally, their relative positioning toward the southward at 87.43 to 86.63 points suggests that a selling cycle may resume progression tentatively. Sellers should exercise caution before entering the market, though.
Discover how we’re fusing cryptocurrency with Web3 gaming.
Is Tamadoge a #memecoin? 💰Is it a game? 👾
— TAMADOGE (@Tamadogecoin) June 8, 2023
… It’s both! We’re a memecoin with utility 💪
Learn how we’re bringing together crypto and Web3 gaming 🤝 https://t.co/oGEiQVJeYh pic.twitter.com/Wj4ighEhUM
Do you want a coin that would 100X in the next few months? That is Tamadoge. Buy TAMA today
Note: Forexschoolonline.com is not a financial advisor. Do your research before investing your funds in any financial asset or presented product or event. We are not responsible for your investing results.


Leave a Reply