Tamadoge Price Prediction, March 29
There has been a mode of market action that shows Tamadoge is precipitating feebly against the valuation of the US dollar, posing hike signs.
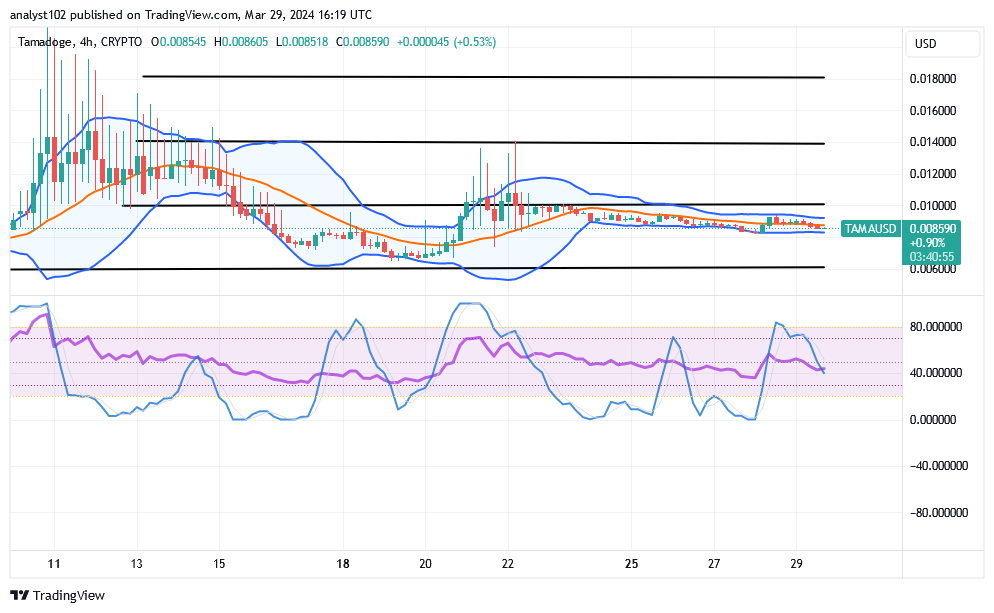
Due to the market’s price actions being restricted to the Bollinger Band indicators’ zones, there has been a protracted production of range price movement. It is important to pay close attention to how the trade will respond, primarily at the lower bound of the Bollinger Band indicators, in order to obtain a reliable cryptocurrency signal that will support rising forces.
TAMA/USD Market
Key Levels
Resistance levels: $0.010, $0.012, $0.014
Support levels: $0.007, $0.006, $0.005
TAMA/USD Medium-term Chart
The TAMA/USD short-term chart showcases that the crypto-economic price is precipitating, posing hike signs.
There has been a prolonged manner of making the Bollinger Band indicators stretch further in the east direction to affirm that some sideways are prevailing against other definite directions. The stochastic oscillators are having their blue part, trying to reach their second part in a southbound-moving style around the point of 40. That calls for a need to exercise some degrees of caution before launching an instant buy signal.
Would it make sense for purchasers to hold off on opening a long position until the TAMA/USD market drops to $0.006?
Just as it has been demonstrated over time, it is not necessary for long-position pushers to wait until the price reverts to a dropping situation toward the point of $0.006 before making comebacks, as it has been that the TAMA/USD market has been placed in a precipitating mode, posing hike signs.
In order not to stage against the technicalities that entailed in the market, re-launching of longing positions should be slicked to by abiding by the principle of stock staking procedures. Letting the price settle into a pattern of relaxation around the lower Bollinger Band trend line would not be enough to prevent it from tending to make more lows before receiving different anticipated longing moves. 
TAMA/USD short-term chart
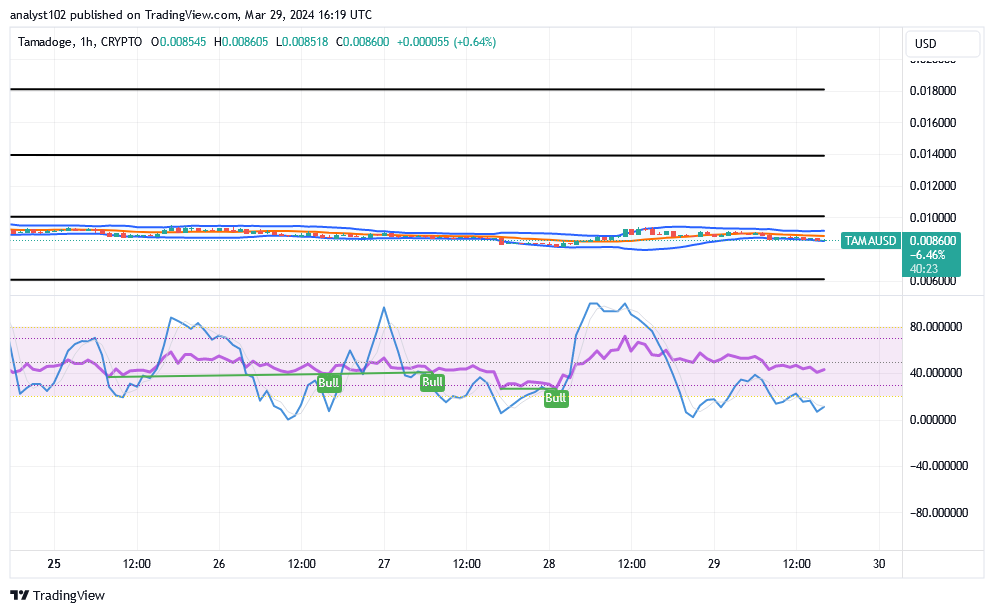
The TAMA/USD short-term chart showcases that the crypto market is precipitating with utmost weakening forces around the lower Bollinger Band, posing hike signs.
The stochastic oscillators are observed crossing the oversold area and a few points below the line of 40. The trend lines of the Bollinger Band have been moving towards the east. We advise purchasers to push for long positions and have hope for some degree of gain in the long-term running cycle that follows.
In this free-to-play Tamagotchi-style game, taking care of your own adorable pet might earn you TAMA! Have fun!
Dive into the fun of our free-to-play Tamagotchi-style app where you can earn $TAMA by caring for your own adorable pet!
— TAMADOGE (@Tamadogecoin) February 29, 2024
Download Tamadogi on Android & iOS now to start earning 👇
📱 Android: https://t.co/RfZIZOLaNJ
📱 iOS: https://t.co/du3iReizS4 pic.twitter.com/gFxppuh3sI
Do you want a coin that would 100X in the next few months? That is Tamadoge. Buy TAMA today
Note: Forexschoolonline.com is not a financial advisor. Do your research before investing your funds in any financial asset or presented product or event. We are not responsible for your investing results.


Leave a Reply