Tamadoge Price Prediction, January 27
A series of smaller bearish candlesticks has been on for a while in the marketing operations between the values of Tamadoge versus the US coin, given the crypto-economic price to run lowly, searching for spiral input.
The best cryptocurrency signal often occurs when a bullish engulfing candlestick stages with the intention of covering some penultimate dropping ones from a lower trading zone. Long-position takers hoping to profit quickly may find it challenging because the price has been moving along the stretching of the lower Bollinger Band trend line for some time without many good trade entries.
TAMA/USD Market
Key Levels
Resistance levels: $0.0060, $0.0070, $0.0080
Support levels: $0.0040, $0.0030, $0.0020
TAMA/USD Medium-term Chart
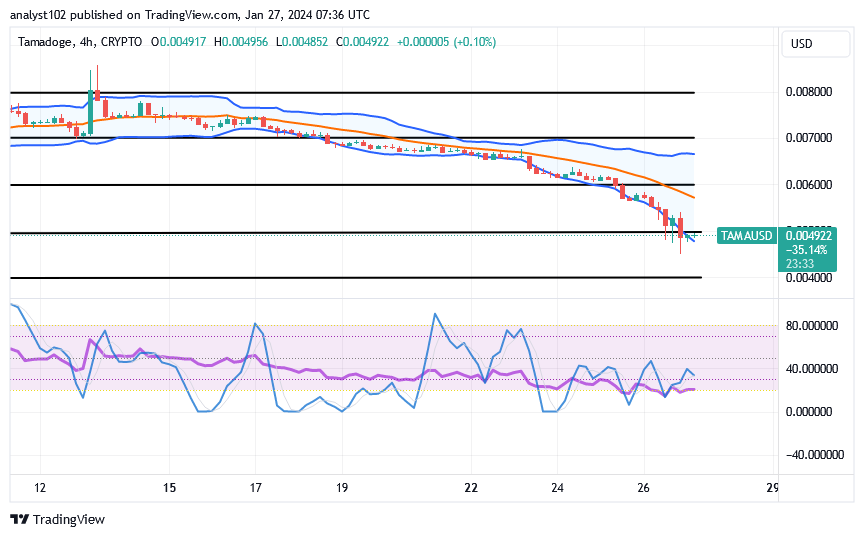
The TAMA/USD medium-term chart reveals that the crypto-economic price is low, searching for spirals alongside the lower Bollinger Band.
The Bollinger Band trend lines are currently pushing through downward points. In the event that the market makes further volatile moves away from its current trade zone of $0.0050, the price will go lower to the point of $0.0040. The stochastic oscillators are in a mode of swerving erratically below the value of 40.
Will the TAMA/USD market continue to drop and remain technically favorable for new sellers below $0.0060?
The furtherance of more draw-downs has not been psychologically okay for short-position pushers to enter fresh positions, given that the TAMA/USD price is low and they are searching for a spiral index.
The gravitational pressure weight that is accumulating along with the correction movements has persisted in being antagonistic to the entry point’s pattern of decent atmospheres. However, we advise investors to adhere to position-taking procedures without concern. Those who use a dip-buying strategy can be confident that a rebound will materialize soon.
TAMA/USD short-term chart
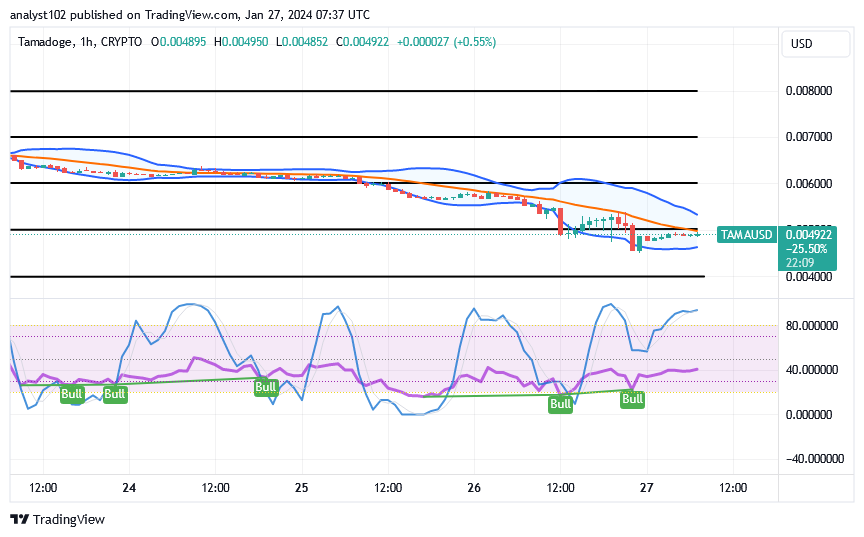
The TAMA/USD short-term chart reveals the crypto-economic price is low, searching for spiral indexes in the zones of the Bollinger Bands.
To indicate the real-time observation of an ideal for getting a nice point at a higher area of the indicators, the Bollinger Band trend lines are still curved southerly. The blue part of the stochastic oscillators has been moving into the overbought area. The factors on the downside appear to be determining how quickly we end up declining further or not.
An organized attack was made on the Tamadoge developer wallet. By taking advantage of a contract flaw, the hackers gained access to the Tamadoge liquidity pool.
The Tamadoge developer wallet was targeted as part of a coordinated attack. By taking advantage of a contract vulnerability, the hackers gained access to the Tamadoge liquidity pool. 🧵 pic.twitter.com/ciVaWyNEx1
— TAMADOGE (@Tamadogecoin) January 25, 2024
Do you want a coin that would 100X in the next few months? That is Tamadoge. Buy TAMA today
Note: Forexschoolonline.com is not a financial advisor. Do your research before investing your funds in any financial asset or presented product or event. We are not responsible for your investing results.


Leave a Reply