Tamadoge Price Prediction, January 5
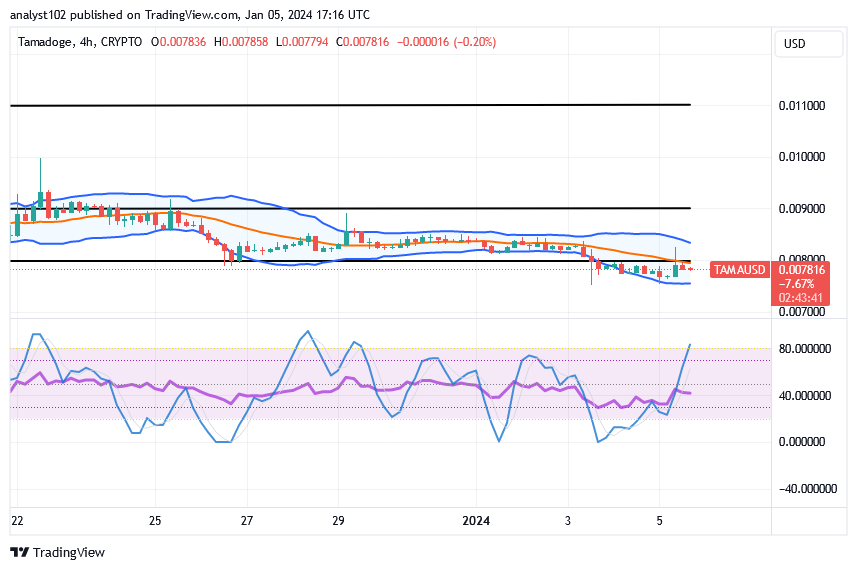
As there has been a consistent slight force succumbing situation by bulls to bears in the market operations of Tamadoge/USD, the crypto-economic price has been observed to be lowering its momentum around the crucial trad spot of $0.00800, floating a hike signal above the support line of $0.00700 at this moment of technical analysis.
A depression price pattern has formed between the middle and lower Bollinger Band indications over the course of a few hours, as indicated by the emergence of variant 4-hour candlesticks. Over time, it has been shown that possibilities for dip buying have been put in an elongation mode, with lesser capacity pressures driving downward, allowing investors to seize the market at the lower end before a vigorous rising motion cycle.
TAMA/USD Market
Key Levels
Resistance levels: $0.0090, $0.0100, $0.0110
Support levels:$0.00700, $0.0065, $0.0060
TAMA/USD Medium-term Chart
The TAMA/USD medium-term chart showcases that the crypto market is lowering around $0.008, floating a hike signal.
There have been a series of candlesticks to signify that velocity on the market is tending to regain momentum from around the spot above the line of $0.00700. The lower Bollinger Band is strategically positioned below the point of $0.00800. The stochastic oscillators have been positioned in a swerving mode to the north, contemplating a penetration of the overbought region.
Now that the price is trading at about $0.007816, what is the trade capacity to the upside that the stochastic oscillators currently predict?
The potentiality of the trade force on the TAMA/USD market showcased by the stochastic oscillators has been to keep faith that the price is garnering catalysts, as the price is lowering around the point of the middle Bollinger Band toward the lows, floating a hike signal.
The oscillators’ swerving process has created challenging conditions in which desired position orders, particularly those from investors, can be carried out. Investors are anticipated to take advantage of the process of obtaining a downward trend in order to scale the cryptocurrency economy at a discounted rate before increasing gravitates return to the north in their proper shape.
TAMA/USD short-term chart
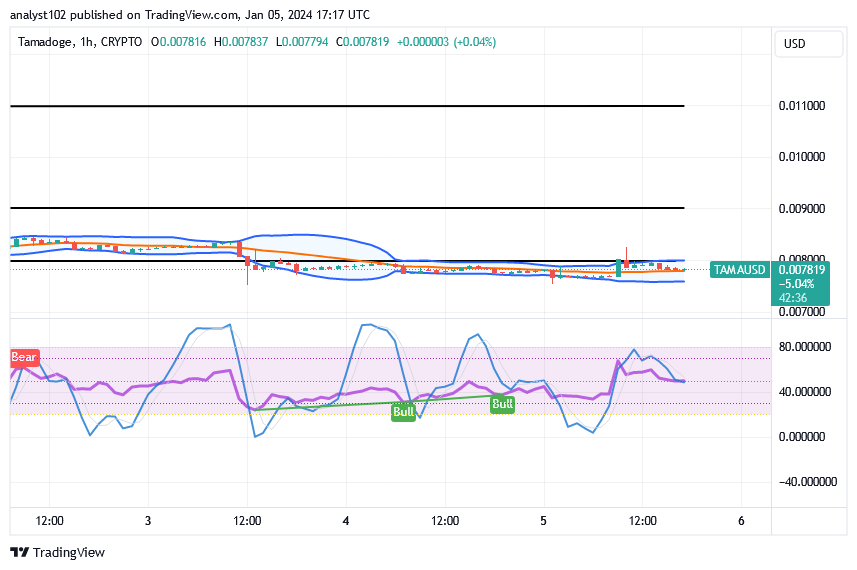
The TAMA/USD short-term chart reveals that the crypto-economic price is lowering to push in ranges, floating a hike signal above the point of $0.00700.
The trend lines of the Bollinger Band have contracted and are now oriented southward around the $0.00800 line. The stochastic oscillators have crossed south to converge above the 40-point at the time of writing. Before a climb resumes, there may yet be a cautious dip to the negative.
In the Tamaverse, there are countless opportunities to earn money!
Check out our selection of games incorporating Tamadogi, Arcade, and Arena to get started right now!
There are endless earning possibilities in the Tamaverse! 🌟
— TAMADOGE (@Tamadogecoin) January 5, 2024
Start today by checking out our series of games featuring Arcade, Arena, and Tamadogi!
📱 Android: https://t.co/D4TjX7gTFl
📱 iOS: https://t.co/0fjJapf5oA pic.twitter.com/YAXGg1MBYs
Do you want a coin that would 100X in the next few months? That is Tamadoge. Buy TAMA today
Note:Forexschoolonline.com is not a financial advisor. Do your research before investing your funds in any financial asset or presented product or event. We are not responsible for your investing results.


Leave a Reply