Tamadoge Price Prediction – June 23
Lesser active actions have predominantly been playing out in the trade activities that involve bulls and bears as regards Tamadoge versus the valuation of the US Dollar, as the crypto market presently moves in recession, holding rebounds signals at lower base bargain zones.
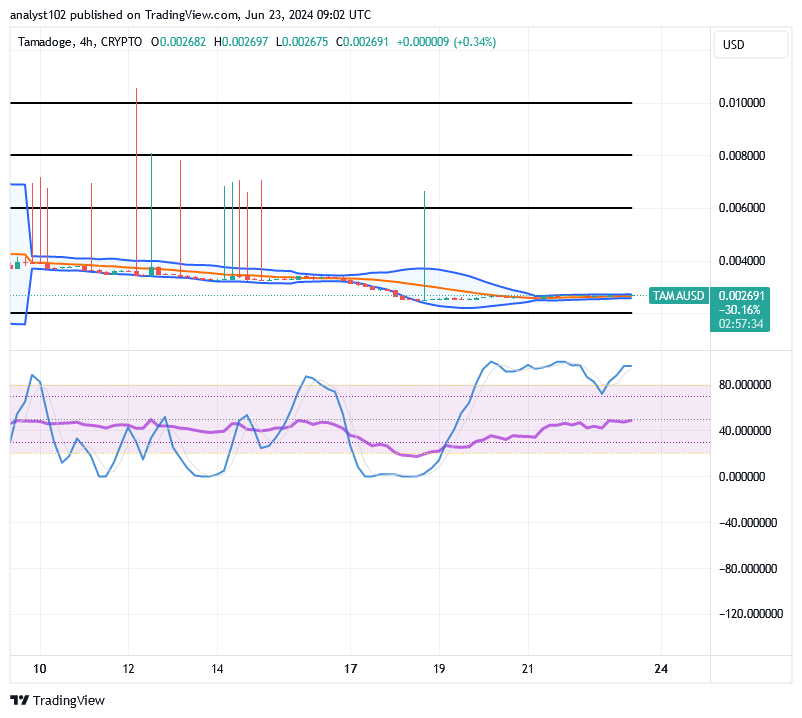
It is possible to clearly notice the creation of different 4-hour candlesticks that indicate the locations of the negotiations beneath the $0.003 line. With a positive input, the market is currently trading at about $0.002691. This means that long-term position pushers must adhere to their position instructions regardless of the number of points they may have gained.
TAMA/USD Market
Key Levels
Resistance levels: $0.004, $0.006, $0.008
Support levels: $0.002, $0.0015, $0.001
TAMA/USD Medium-term Chart
The TAMA/USD medium-term chart showcases that the crypto market is in recession, holding rebounds in the zones of the Bollinger Bands.
The stochastic oscillators have been in the overbought area, veering to the east to signal the possibility that market bulls will soon begin to set up a consolidation moving mode, which may quickly push several lines of catalysts through various resistances. The Bollinger Bands’ positioning situation indicates that neither the seller nor the buyer have established firm dominance over the market.
Given the current state of the TAMA/USD market, should traders hold off on entering positions until the next active price action appears?
The market exchange state still considers one of the best dip-buying window opportunities that investors shouldn’t let pass them by, given that the TAMA/USD market is currently in recession and holding rebounds signals.
As the anticipated projection values have not yet materialized and the bullish trend is still continuing, more positions should be staked in the developing crypto economy in the coming months. Technically speaking, long-term position holders may not want to wait for a repositioning set-up of the stochastic oscillators in or at lower places before resuming long-term orders at this time.
The TAMA/USD short-term
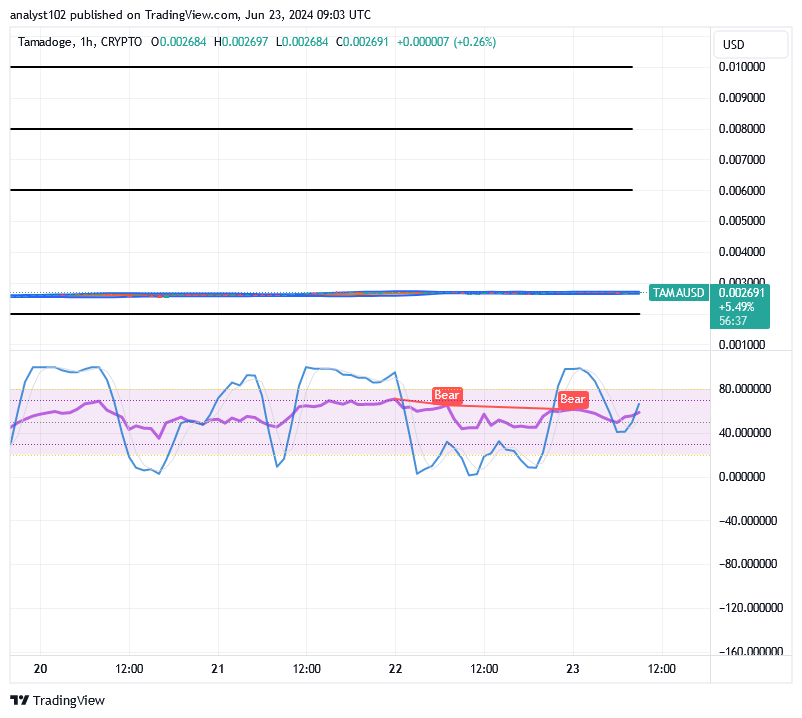
The TAMA/USD short-term chart shows the cyrpto market is in recession, holding rebounds trade signals.
Smaller candlesticks have been exhibiting a tightening, contracting, and stretching pattern in the eastward direction of the Bollinger Bands indicators. From the perspective of an hourly chart, the stochastic oscillators now show that bears are comparatively managing to maintain dominance over the market. However, they are also observed attempting to veer back upward just below the 80-line. That suggests that there might be an extraordinary rebound later on.
Children today have no idea what hard work entails.
Kids these days don’t know what hard work is… 😅🎮💪#Tamadoge #PlayToEarn #CryptoGaming #P2E pic.twitter.com/CTcodT4AoR
— TAMADOGE (@Tamadogecoin) June 21, 2024
Do you want a coin that would 100X in the next few months? That is Tamadoge. Buy TAMA today
Note: Forexschoolonline.com is a financial advisor. Do your research before investing your funds in any financial asset or presented product or event. We are not responsible for your investing results.


Leave a Reply