Tamadoge Price Prediction, February 18
Reactions of buyers and sellers in the market operations of Tamadoge versus the valuation of the US Dollar have been closely observed to be in positive swings, as the trade lowers actions toward producing further fearful up rising motions.
That said, it is imperative that traders pay attention to critical points that act as supports and resistances in relation to potential future directions for the exchange line from its current position. The activities that follow will have a great opportunity to delay some tenable downs, as it has been anticipated, because the $0.004 line will continue to point in the direction of the all-time low value, which will not be exceeded.
TAMA/USD Market
Key Levels
Resistance levels: $0.0065, $0.0075, $0.0085
Support levels: $0.005, $0.0040, $0.0030
TAMA/USD Medium-term Chart
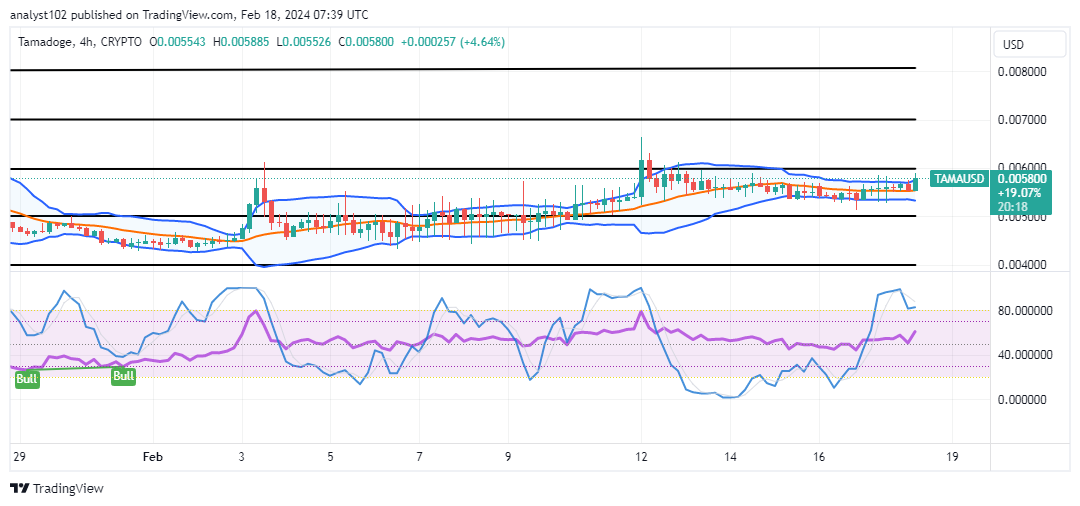
The TAMA/USD medium-term chart showcases the crypto-economic market is in positive swings, lowers actions.
The Bollinger Band trend lines have continued to push to the east within the lines of $0.006 and $0.005 to demonstrate that sideways movements are still much in place. The stochastic oscillators are in the overbought region, swerving up and down in preparation of a determined trend. 
What barrier trade zone should the TAMA/USD market bulls have to break, and keep as the Bollinger Bands place in the points of $0.006 and $0.005?
The main resistance trade arena for the TAMA/USD market purchasers have push against for sustainability remains at $0.006, given that the price is in positive swings, lowers actions.
As of the time of analytics article, a 4-hour candlestick is forming around the upper Bollinger Band trend line, indicating that the buyer needs to put on additional muscle to ultimately produce stable, aggressive rising forces. The price will potentially return to a cycle of reversals in the vicinity of the Bollinger Bands, though, if the scenario simply becomes one of positive gravity. Buyers will regain their bitcoin values at lower prices worldwide in the wake of that assumption beginning to spill over, just as it did in previous actions.
The TAMA/USD short-term
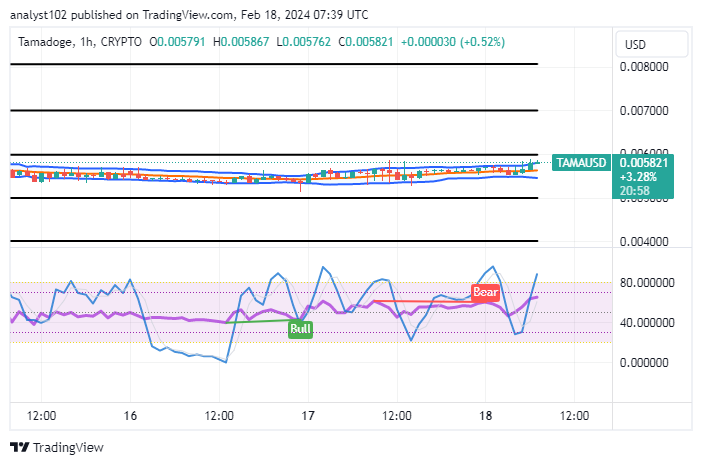
The TAMA/USD short-term chart reveals that the crypto market is in positive swings as it lowers around the upper Bollinger Band.
Since the Bollinger Bands are positioned and stretched to the east inside the points of $0.006 and $0.005 across multiple sessions, the degree of price action that the market has implemented is the result of the indicators’ repositioning pattern. The stochastic oscillators are approaching the overbought area and are veering sto the north.
We are happy to notify you about Tamadoge’s impending move to Polygon! Check out the details in this thread or in our Discord channel. 1/8
We’re excited to announce that Tamadoge is moving to Polygon! Read the details in this thread or on our discord. 1/8 pic.twitter.com/PjgxJa8TDa
— TAMADOGE (@Tamadogecoin) January 29, 2024
Do you want a coin that would 100X in the next few months? That is Tamadoge. Buy TAMA today
Note: Forexschoolonline.com it a financial advisor. Do your research before investing your funds in any financial asset or presented product or event. We are not responsible for your investing results.


Leave a Reply