Tamadoge Price Prediction – April 24
A persistent dropping cycle in the TAMA/USD market operation has provided a window to buy now at a cheaper rate before a rebound resumes from the current lower-trading zone of the $0.02000 support level. Over time as regards today’s trading zones, the price has featured between $0.023075 and $0.021951 value lines at a considerable negative percentage point of 4.38, indicating a significant figure. Therefore, optimistically, in this emerging crypto economy, investors should formulate a policy of buying more during the prevalence of declines.
TAMA/USD Market
Key Levels
Resistance levels: $0.03000, $0.03500, $0.04000
Support levels: $0.01500, $0.01000, $0.00500
TAMA/USD – 4-hour Chart
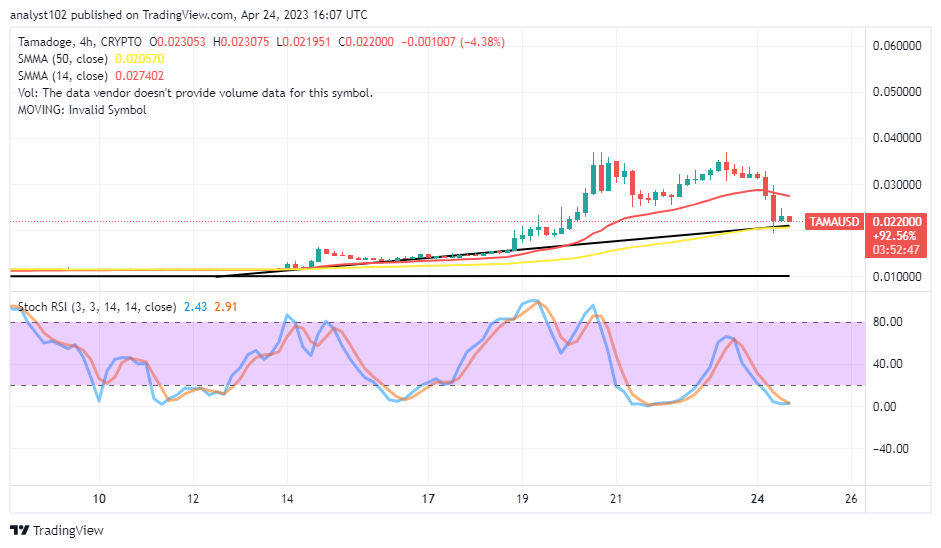
The TAMA/USD daily chart showcases the crypto market is in a window to buy now at a cheaper rate as it is around the value of the bigger SMA trend line. The 14-day SMA indicator is at $0.027402 above the $0.020570 point of the 50-day SMA indicator. An indication has trailed the formation of a 4-hour candlestick to signify the possibility of not seeing reliable drops farther below the bigger SMA longer than necessary in the following operations. The Stochastic Oscillators are down into the oversold, penetrating at 2.91 and 2.43 levels.
What is the extremely riskier support spot the TAMA/USD market could push lower away from its current capacity?
It has shown on the medium-term trading chart that the baseline drawn around the $0.01000 support line serves as the extreme-end trading point as the TAMA/USD price is in a dropping window to buy back at a cheaper rate. As it is, it would remain the better technical trading approach to purchase more in any pairing business activities while the price is falling. But, long-position takers would only have to be strategic based on variant principles guiding longing entries.
On the downside of the TAMA/USD technical analysis, going by the current weight of the declining capacity, bears may put to a whipsawed trading moment if they intend to follow a sudden fall-off around the 50-day SMA trend line in the near time. A crossing of the Stochastic Oscillators to the northbound in the oversold region supported by a beefing-up candlestick will suffice to leverage a reliable buy signal against the mode of sellers in the Tamadoge business transactions.
TAMA/USD 1-hour chart
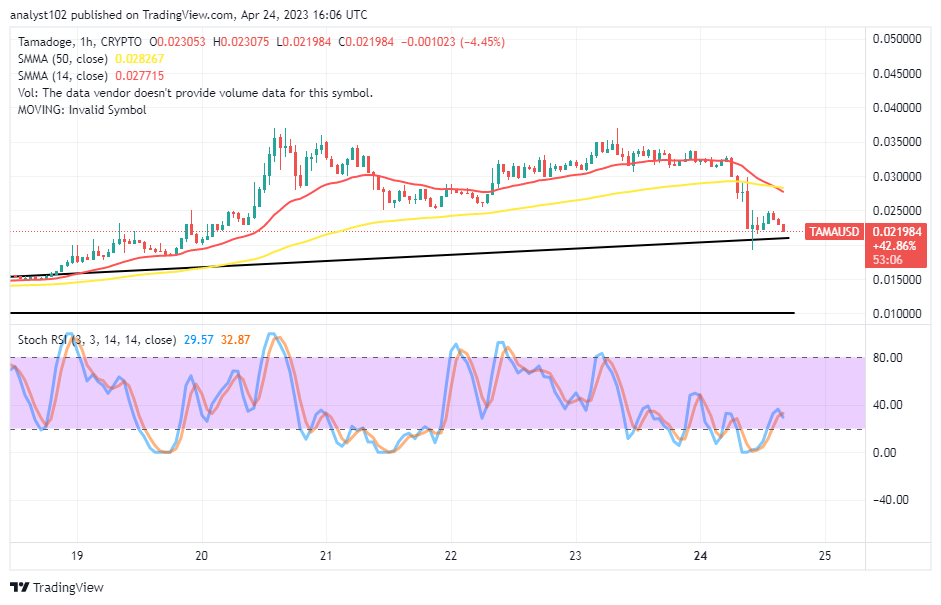
The TAMA/USD 1-hour chart showcases the crypto-economic price in a window to buy now at a cheaper rate. In the next several hours, if the US currency fails to force the market line below the $0.02000 level, a bounce will quickly resurface to claim back some lost points. The 14-day SMA indicator is at $0.027715. And the 50-day SMA indicator is at $0.028267. And they are in an attempt of intercepting to the downside. The Stochastic Oscillators have been positively complying along a southbound-moving path to the position at 32.87 and 29.57 levels. Some rebounds will be around or between the values of $0.02000 and $0.01500 in the ensuing cycle. As a result, consumers ought to keep pushing the buy button.
Forget about Babydoge, TAMA is winning! In the coming days, it will be listed on top CEXs.
https://twitter.com/Tamadogecoin/status/1650440468637818881/photo/1
Do you want a coin that would 100X in the next few months? That is Tamadoge. Buy TAMA today
Note: Forexschoolonline.com is not a financial advisor. Do your research before investing your funds in any financial asset or presented product or event. We are not responsible for your investing results.


Leave a Reply