Tamadoge Price Prediction, December 18
There has been a consistent level of compliance with the falling motion that has prevailed in the transaction lines between Tamadoge and the US coin, given that the crypto-economic price currently hovers around $0.00900, resettling for hikes.
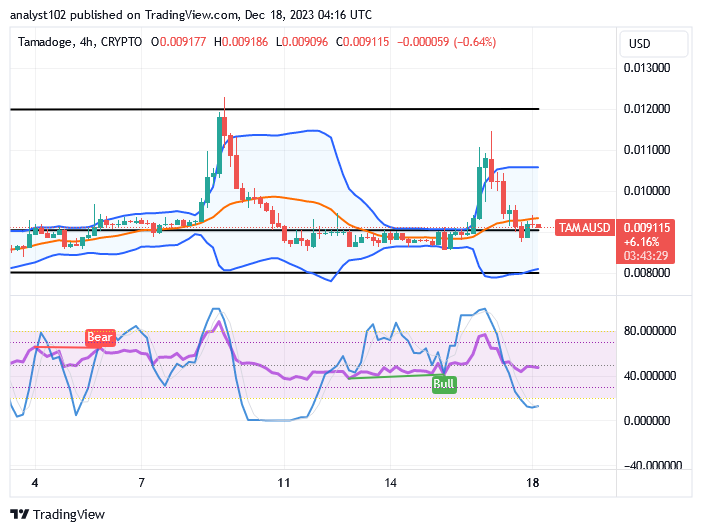
The majority of signs indicate that the remaining downward pressure on the cryptocurrency market has been progressively lessening, potentially resulting in a process of energy recovery from lower zones located below the middle Bollinger band’s trend line. As things stand, the $0.00800 support trade spot has the probability of acting as the most important underlying support to be broken southerly in the event that volatility moves lower.
TAMA/USD Market
Key Levels
Resistance levels: $0.010, $0.011, $0.012
Support levels:$0.00800, $0.0075, $0.0070
TAMA/USD Medium-term Chart
The TAMA/USD medium-term chart showcases the crypto market hovering at the trading arena of $0.00900, resettling for hikes in the mood.
The Bollinhger Band trend lines are still placed around the values that we have been witnessing over some days, with the middle part being the major concentration spot of the bargaining process at the time of this technical piece. The stochastic oscillators have dipped into the oversold region to denote that selling activities are liable to lose formidable form in the wake of more downs.
Is the current downward trend reaching a typical optimal bottom line that will allow the bulls in the TAMA/USD market to rally once more?
Over time, it has been demonstrated that the declining motion has been featured around the decimal points in the TAMA/USD market activities as the crypto’s price hovers around $0.00900, resettling for hikes.
The majority of the indicators currently suggest that buyers may now initiate optimal DTP buying sessions without taking into account the possibility that the market will continue to decline toward the lower Bollinger Band zone. From this positional trade point, we advise that the position-gathering procedure be maintained.
TAMA/USD short-term chart
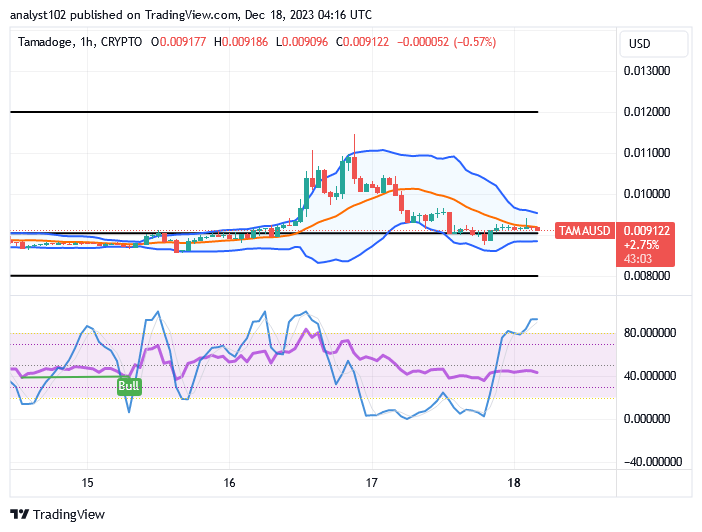
The TAMA/USD short-term chart shows the crypto’s price hovers around the axis of $0.00900, resettling for hikes.
Indicators for the Bollinger Band have been moved to keep the bush flag shape between $0.010 and $0.00800. The blue line is in the overbought area, according to the stochastic oscillators. The repositioning order suggests that bulls should hold off on launching a strong recovery for the time being.
Make $TAMA using our staking platform to invest your gains after playing games like Tamadoge Arena.
✅ Play
— TAMADOGE (@Tamadogecoin) December 15, 2023
✅ Earn
✅ Stake
Earn $TAMA playing games like Tamadoge Arena and then put your winnings to work using our staking platform 👉 https://t.co/Qa1cAZ5Qyh pic.twitter.com/BdcqPbX57K
Do you want a coin that would 100X in the next few months? That is Tamadoge. Buy TAMA today
Note:Forexschoolonline.com is not a financial advisor. Do your research before investing your funds in any financial asset or presented product or event. We are not responsible for your investing results.


Leave a Reply