Tamadoge Price Prediction, February 10
There has been a sense of trade activity to showcase that a condition to signify an end to getting a definite direction has not been ascertained, given that the TAMA/USD market is fickle around the value of $0.005, tending to hold hikes.
The role that extraordinary rebounding forces used to play in the current standard exchange line has been abundantly demonstrated. A cursory examination of the stochastic oscillators’ technical reading status based on a daily chart configuration indicates that a sequence of delays may still occur prior to any recoveries. That being said, there will undoubtedly be some deliberate southerly advances in order to allow favorable environments to regain ground at a lower cost.
TAMA/USD Market
Key Levels
Resistance levels: $0.0060, $0.0070, $0.0080
Support levels: $0.0040, $0.0030, $0.0020
TAMA/USD Medium-term Chart
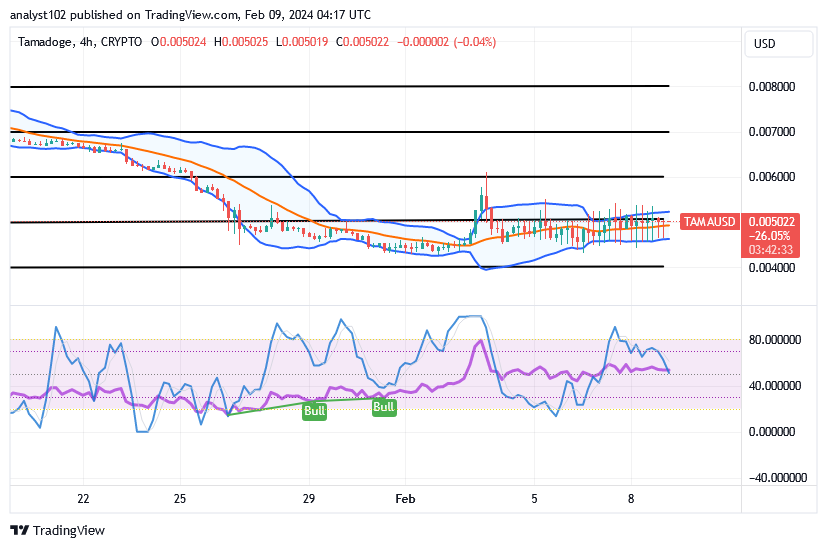
The TAMA/USD medium-term chart reveals that the crypto market is fickle, tending to hold the hike signal above the lower Bollinger Band.
The variant price movements on the formations of candlesticks based on 4-hourly formations appear to indicate that a line of precautionary trade sessions is still observed as of the time of this analysis. All the trend lines of the Bollinger Bands have shrunk easterly to stay around the point of $0.005. The stochastic oscillators are relatively conjoined to point southward, a bit above the point of 40.
Should sellers rely on the TAMA/USD’s middle Bollinger Band as support given the bearish candlestick that has crossed it?
As it has been rightly witnessed that a fall-off motion has been observed in the TAMA/USD trade as of this piece, it could also be a time that sellers might not be making it deeper southerly away from the zone of the middle Bollinger Band indicator, given that the price is fickle and tends to hold hikes.
Reexamining the stochastic oscillator indicators’ repositioning posture on a daily chart in the overbought area indicates that any more buying orders are putting out a high-profile warning signal to proceed with caution. But, as anticipated, there is a chance that an explosive spike will emerge in no time, which will unexpectedly place the length of the candlesticks in positive higher trade zones afterwards.
TAMA/USD short-term chart
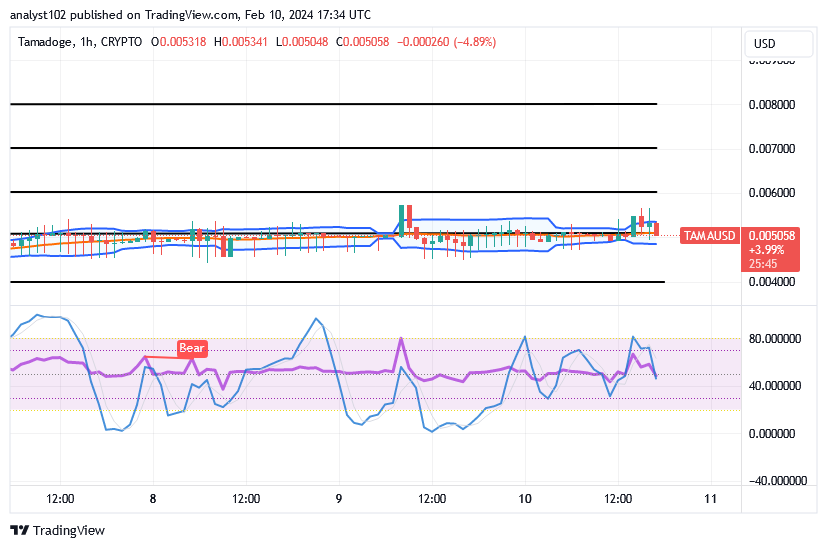
The TAMA/USD short-term chart showcases that the crypto economy is fickle, tending to hold hikes above the horizontal line of $0.004.
The underlying support line at $0.004 and the resistance line at $0.006 have held up over time as the Bollinger Band trend lines’ persistent easterly stretching around the $0.005 point. From the top of 40, the stochastic oscillators are pointing slightly downward. That suggests that the base instrument might continue to remain at certain lower lows with fewer threatening steady pressures. More windows of opportunity to purchase from the dips will replace that in the long run.
We are thrilled to inform you that Tamadoge will be relocating to Polygon! Read the information on our Discord channel or in this thread. 1/8
We’re excited to announce that Tamadoge is moving to Polygon! Read the details in this thread or on our discord. 1/8 pic.twitter.com/PjgxJa8TDa
— TAMADOGE (@Tamadogecoin) January 29, 2024
Do you want a coin that would 100X in the next few months? That is Tamadoge. Buy TAMA today
Note: Forexschoolonline.com is not a financial advisor. Do your research before investing your funds in any financial asset or presented product or event. We are not responsible for your investing results.


Leave a Reply