Tamadoge Price Prediction, January 14
The price action relaxation movement has resumed, featuring around the point of the middle Bollinger Band trend line as the TAMA/USD market is down and mustering spike signs.
There is a buying wall created as a result of the recent bullish candlestick around the line $0.00700, which remains valid against seeing more stable decreases. The trading line that the price is speculatively attempting to retrace in order to resume rising forces is located at the $0.0075 mark. For long-term position takers, now would be a good time to hold onto their strategy of accruing further positive points.
TAMA/USD Market
Key Levels
Resistance levels: $0.0080, $0.0085, $0.0090
Support levels: $0.0070, $0.0065, $0.0060
TAMA/USD Medium-term Chart
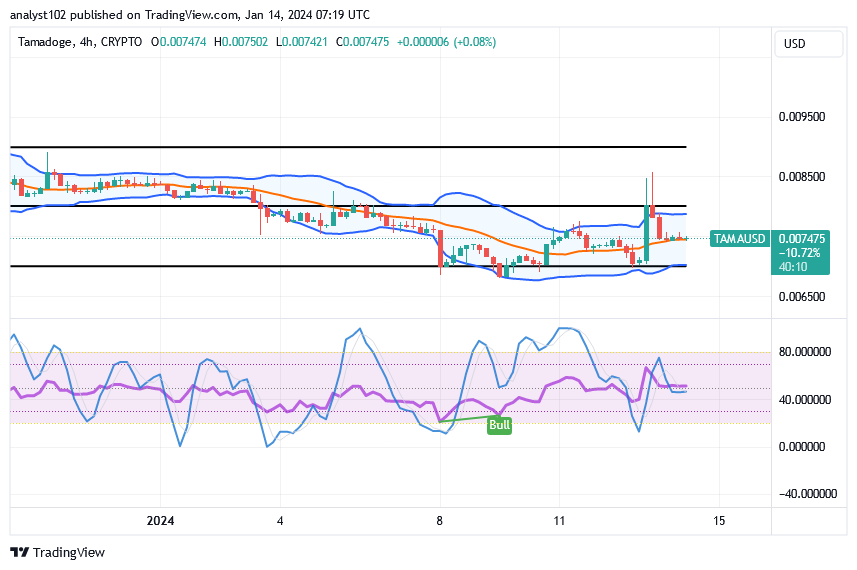
The TAMA/USD medium-term chart showcases that the crypto-economic price is down, mustering spike signs above the line of $0.0070.
The Bollinger Band trend lines are strategically positioned around the points of $0.0080 and $0.0070. Less powerful declining forces are going to be released on the falling motion to gently let the formation of candlesticks regain a point to make back an upward swinging force. The stochastic oscillators have been positioned around 50 points to create a ranging style.
Has there been a trading signal that suggests more consistent dips against the $0.00700 line?
About three to four 4-hour candlesticks have been in the making around the middle Bollinger Band trend line to give a belief that moves to the south side won’t last longer than necessary, as the TAMA/USD market is down, mustering spike signs.
It is unclear as of this technical analytics article whether the bears will shift their positions to retest a support base in the vicinity of the $0.00700 line in the near future. Additionally, this might be a better moment to contribute more to positive position-taking if that opinion is proven false. It is important for investors to remember that cryptocurrency economies are progressively positioned for extremely bullish runs. Thus, the majority of investment positions that were previously purchased at higher rates will eventually see a recovery.
TAMA/USD short-term chart
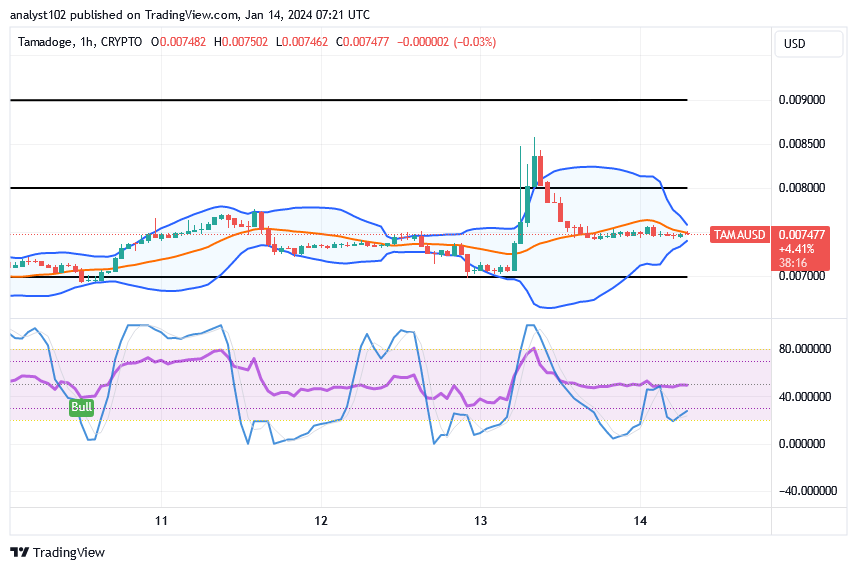
The TAMA/USD short-term chart reveals that the crypto-economic price has been down, mustering spike signs.
The Bollinger Band trend lines have been getting repositioned to showcase that a shrinking pattern is in place, backing a state of ranges around the line of $0.0075. The stochastic oscillators have had their blue line put closely to the oversold region, indicating that falling gravity is probably going to lose stances. Repurchase operations must therefore start as soon as a bullish candlestick appears.
There’s not much longer to climb to the top of the weekly leaderboards!
Choose your preferred Tamadoge game, reserve your place, and start playing!
The weekly leaderboards are closing in – it’s your last chance to climb to the top! 🎮
— TAMADOGE (@Tamadogecoin) December 27, 2023
Play your favorite Tamadoge game, secure your spot, and let the games begin!
Find all of our games with the links below 👇
📱 Android: https://t.co/YULpfGci8o
📱 iOS: https://t.co/3BEB2FjtkH pic.twitter.com/lmq793HZlm
Do you want a coin that would 100X in the next few months? That is Tamadoge. Buy TAMA today
Note:Forexschoolonline.com is not a financial advisor. Do your research before investing your funds in any financial asset or presented product or event. We are not responsible for your investing results.


Leave a Reply