Tamadoge Price Prediction – July 25
Less active activities have predominated the propensity buying signal that the TAMA/USD market bulls have maintained over time, given that the crypto-economic price is building a base for support around $0.01000 as it is swinging high with delaying sustainable rise forces.
Because of the resistance that some of the attempted upsurges encountered before reaching the higher value line mentioned earlier, there is still a lot of exchange activity regularly observed between the values of $0.01200 and $0.01000. Long-term, if the smaller line breaks down, the market will be able to identify even lower levels above $0.0090 or very near it.
TAMA/USD Market
Key Levels
Resistance levels: $0.01200, $0.01400, $0.01600
Support levels: $0.01000, $0.00900, $0.00800
TAMA/USD Medium-term Chart
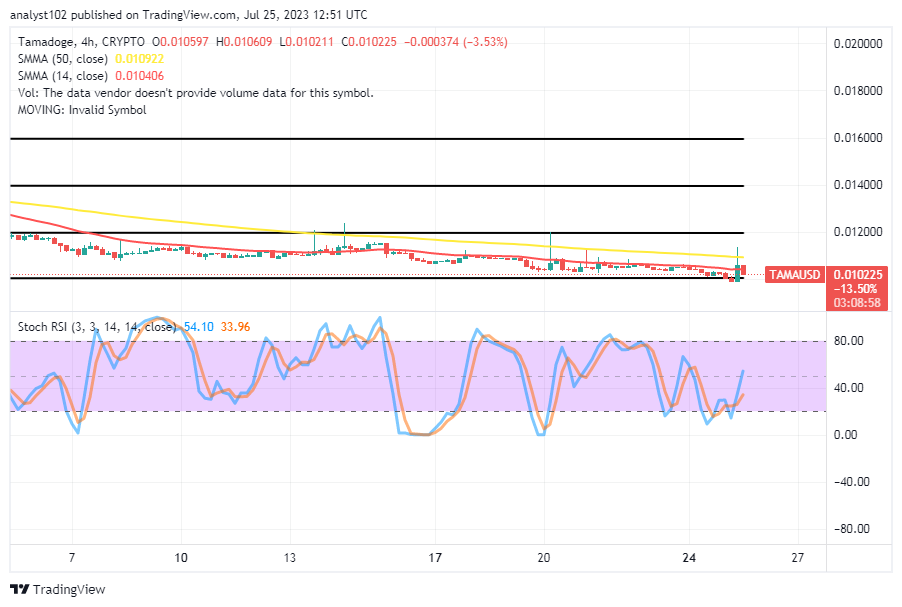
The TAMA/USD 4-hour chart showcases that the crypto-economic price is building a base and swinging high after obtaining a stand from around the point of $0.01000 in the long run.
The indicators’ reading potency signal comes from the positional values of $0.010922 and $0.010406, as the 14-day SMA trend line is underneath the 50-day SMA trend line. The Stochastic Oscillators have been managing to swerve back northbound from the oversold region to give a promissory resumption note of seeing a line of bounces.
Should sellers in the TAMA/USD market continue through the $0.01000 threshold given the long-term outlook?
At the moment, the falling pace in the TAMA/USD market has only been gaining momentum as the crypto trade is building a base and swinging high from the bargaining spot of $0.01000.
What have been the reactions to the price around the $0.01000 support line over the past couple days?
The price reaction around the point of the $0.01000 support line has been that the TAMA/USD market is building a base and swinging high ahead of a massive rebound.
Most of the declining forces featured have been regaining a foothold around the trade spot of $0.0100. By the time a sustainable bullish candlestick forms, buying from this current lower-trading level won’t come back into play. When that time comes, the pressure to buy will be greater. Technically speaking, it would be best to open up more positions prior to that predicted trade cycle.
TAMA/USD Short-term chart
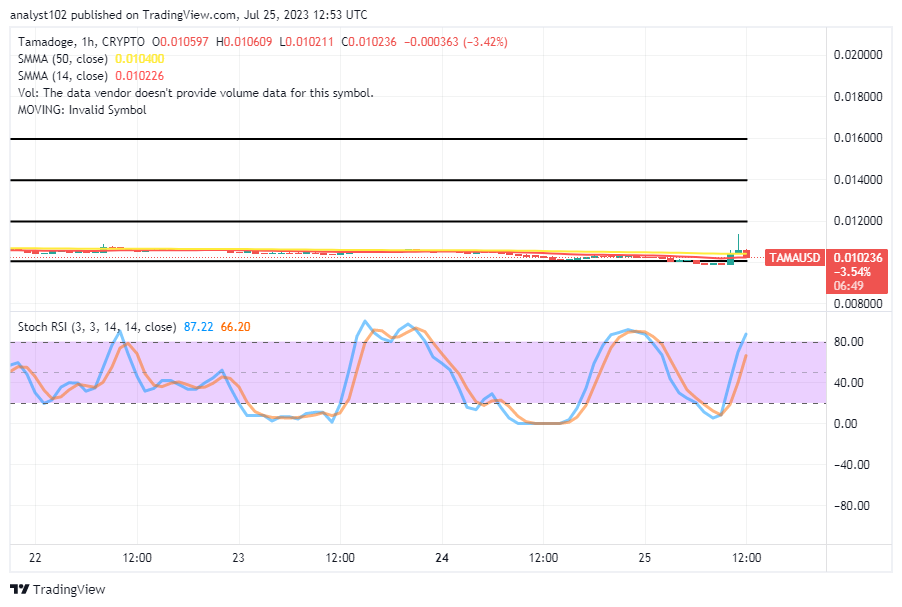
The TAMA/USD short-term chart reveals the crypto-economic price is building a base, swinging high in a low format ahead of the major presumed northward pushes.
To provide a consistent confirmation of the restart of the buying signal, the 14-day SMA indicator needs to cross the 50-day SMA indicator to the upside. The stochastic oscillators have moved from the oversold area to a position between 66.20 and 87.22 in a northerly direction. Buyers may be looking to place an immediate long position order in the interim.
You can participate in the action on the following Apps and Play Stores:
POV: You just downloaded the Tamadoge app 🕺
— TAMADOGE (@Tamadogecoin) July 25, 2023
You can get in on the action in the App and Play stores below:
🍏: https://t.co/k3NV8IkixH
🤖: https://t.co/KjO2dW3bGH #Web3Gaming #Tamadoge #P2EGame pic.twitter.com/kvlyCvrUQJ
Do you want a coin that would 100X in the next few months? That is Tamadoge. Buy TAMA today
Note: Forexschoolonline.com is not a financial advisor. Do your research before investing your funds in any financial asset or presented product or event. We are not responsible for your investing results.


Leave a Reply