Tamadoge Price Prediction – August 14
It has been a market condition of not letting a definite directional price wave between short and long position movers of the TAMA/USD market, as the financial trend reveals that the crypto economy is basing around $0.002, finding a shoot-up sign.
Both bulls and bears have been forced to stay close to the $0.002 value line over an extended length of time due to the replication of strong moves in the TAMA/USD transaction. However, our suggestion is still that position-staking procedures should take precedence over other feelings.
Key Levels
Resistance levels: $0.003, $0.004, $0.005
Support levels: $0.002, $0.0015, $0.001
TAMA/USD Medium-term Chart
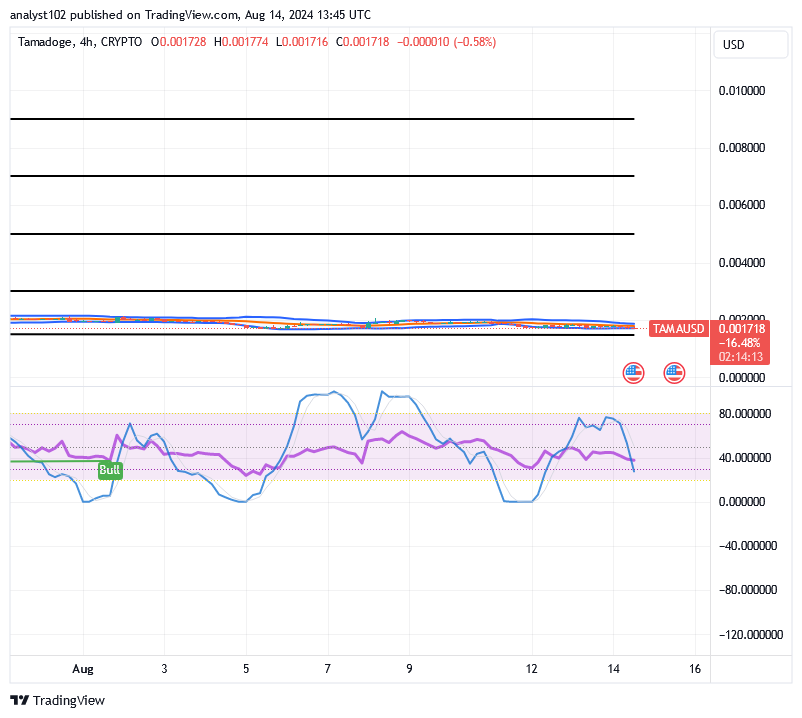
The medium-term TAMA/USD chart shows the crypto-economic price is basing around $0.002, finding a shoot-up condition to capitalize on.
If a bullish candlestick eventually emerges out of the current bargaining outlook, the shoot-up will formidably generate a decent buying wall for the subsequent price actions. The Bollinger Bands trend lines are facing the east, keeping around the formation of several smaller candlesticks. The stochastic oscillators are slightly swerving southbound toward the line of 20, indicating that the velocity capacity of the price is getting smaller gradually.
Which direction should the TAMA/USD market dealers be wary of as the price is basing around $0.002?
As the price of TAMA/USD market is basing around $0.002, traders need to be cautious of going alongside any powerful movements aim at pushing down further, given that the price is finding a shoot-up signal.
Some touches are liable to be featuring relatively against $0.002 to let buyers lookout for potential recouping of momentum. If that has to be the case, investors, traders, and purchasers are advised to hold on to the accumulation of Tamacoin against the US Dollar on a long-term basis.
The TAMA/USD short-term
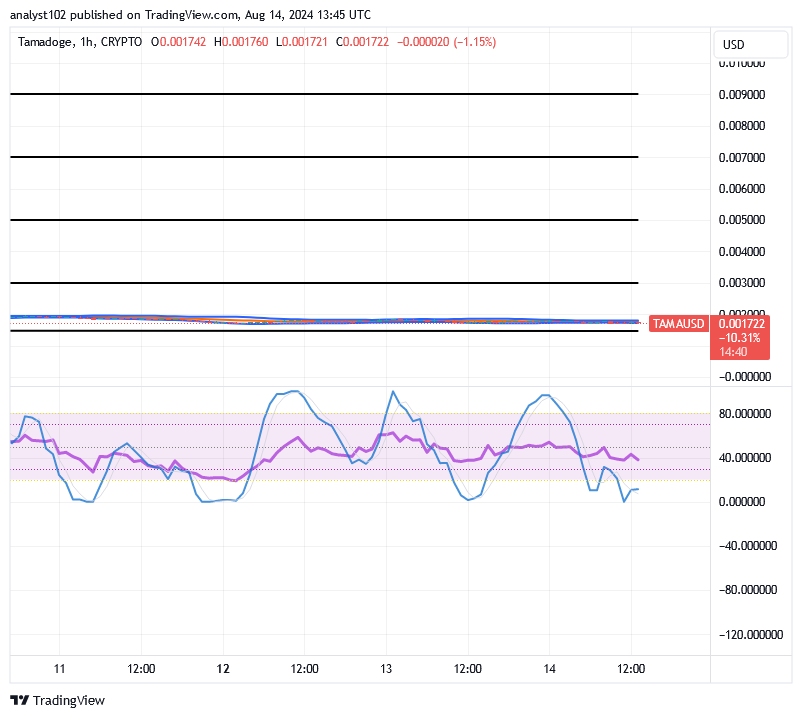
The TAMA/USD short-term chart reveals that the crypto-economic price is basing around $0.002, finding a shoot-up sign.
Smaller candlesticks have been steadily forming next to the Bollinger Bands’ trending lines. Additionally, they have primarily featured values around $0.002. Moving back southward into the oversold area, the stochastic oscillators indicate that taking more down steps could not be sustainable in the short-term running mode. Consequently, purchasers must buckle up in order to receive a purchase order..
Gamers of #Tamadoge, take note! This is your final chance to move up the scoreboard for this week!
🚨 Attention all #Tamadoge gamers! It’s your last shot to climb this week’s leaderboard! 🚨
— TAMADOGE (@Tamadogecoin) August 7, 2024
Start playing any game now in the Tamaverse and earn your share of $TAMA rewards.
Get in on the action now! 👇 pic.twitter.com/5rctPoReet
Do you want a coin that would 100X in the next few months? That is Tamadoge. Buy TAMA today
Note: Forexschoolonline.com is a financial advisor. Do your research before investing your funds in any financial asset or presented product or event. We are not responsible for your investing results.


Leave a Reply