Tamadoge Price Prediction, December 4
The financial book of records of the Tamadoge versus the valuation of the US coin has been witnessing increases over time before the price currently inverts at $0.009, resetting hike indexes.
The reintroduction of bears has been legitimately related to a pit stop method of trading that appears to be exhibiting around the $0.009 zone to show that bulls are flexing their muscles greatly to push over the upper range-bound line. Sometimes, though, it can still be necessary to give the market some room to breathe before deciding on a clear course from the trade place. Investors must steadfastly adhere to the buying and holding ethics idea until additional, more powerful forces of revolt are attained.
TAMA/USD Market
Key Levels
Resistance levels: $0.009500, $0.01000, $0.01050
Support levels:$0.00800, $0.007500, $0.007000
TAMA/USD Medium-term Chart
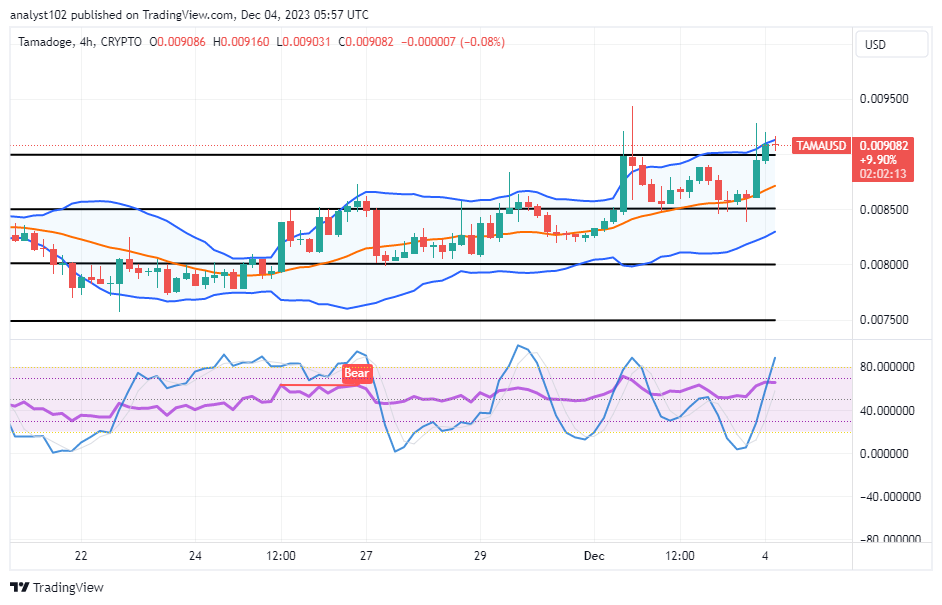
The TAMA/USD medium-term chart reveals that the crypto-economic price inverts at $0.009, resetting inputs around the upper Bollinger Band trend line.
The Bollinger Band trend lines are positioned slightly northbound, with a round of trade contention moments around the upper side. There have been a sizeable number of rejections, briefly above the point of $0.009. The stochastic oscillators are now penetrating the overbought region to give the outlook that buyers are potentially heading for an exhaustion of increases.
Should investors start pulling out of the agreements now that the TAMA/USD market is inverting at $0.009?
It would amount to an unripe trading situation for the TAMA/USD market long-term capitalists to back out of the business, given the crypto-economic price inverts at $0.009, resettling hikes.
Given that the buying trend has gradually and steadily increased from the lower-trading zones of $0.00800 to the stage around $0.00900, long-position pushers are anticipated to maintain a low profile when entering the market. Given the current situation, larger values will soon be covered. As a result, investors must stick to their strategy for making investments. If buyers plan to enter the market soon, they will most likely do so strategically.
TAMA/USD short-term chart
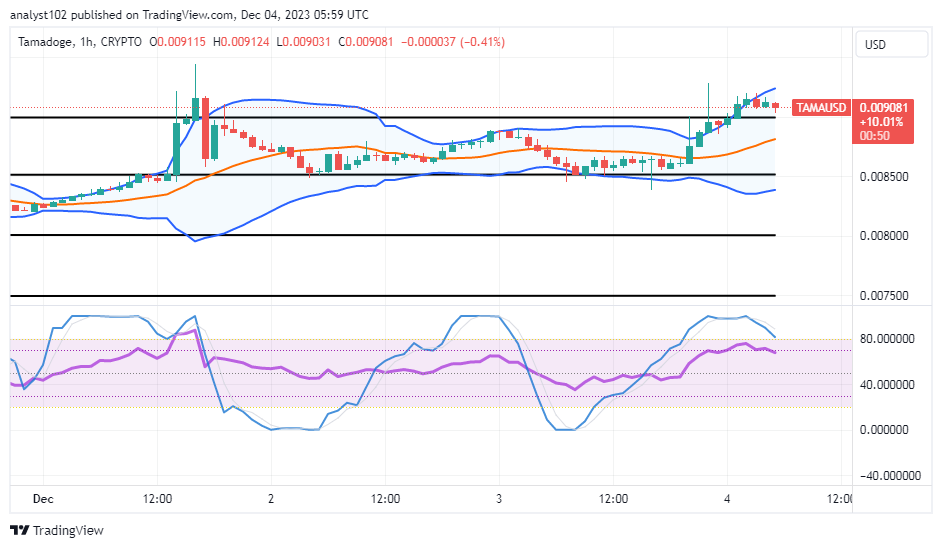
The TAMA/USD short-term chart showcases the crypto-economic price inverting at $0.009, resetting hikes by way of indicators.
The overbought area of the stochastic oscillators indicates that a downward force is positioned in a slow-moving mode. Based on hourly arrangement, the Bollinger Band trend lines indicate that a series of smaller bearish candlesticks is currently forming. The oscillating tool must be used extensively to identify oversold positions, particularly on the hourly trading chart, before prelaunching purchase orders because they will typically revert to their previous northward direction.
It’s at hand! We’re happy to announce that Tamadogi, our newest game, is now playable on iOS and Android!
It’s here! We’re pleased to announce our latest game Tamadogi is available to download on Android & iOS!
— TAMADOGE (@Tamadogecoin) November 30, 2023
Download now to look after your own Tamadoge 👇
📱 Android: https://t.co/RfZIZOLaNJ
📱 iOS: https://t.co/du3iReizS4 pic.twitter.com/LfFP7RIVPQ
Do you want a coin that would 100X in the next few months? That is Tamadoge. Buy TAMA today
Note:Forexschoolonline.com is not a financial advisor. Do your research before investing your funds in any financial asset or presented product or event. We are not responsible for your investing results.


Leave a Reply