Tamadoge Price Prediction – October 3
The pricing style to push out of the range-bound pattern in the TAMA/USD market is yet to be accomplished, given that the crypto-economic price now hovers slightly against $0.001, trying hikes.
Before any potential aggressive recoveries, long-position movers should try to pick up further values around the indicators’ lower-trading bottoms. As it has been overly exhibited in the emerging instrument from the side of basement, it is hygienically reasonable to continue with staking orders.
Resistance levels: $0.0015, $0.0025, $0.0035
Support levels: $0.00075, $0.0005, $0.00025
TAMA/USD Medium-term Chart
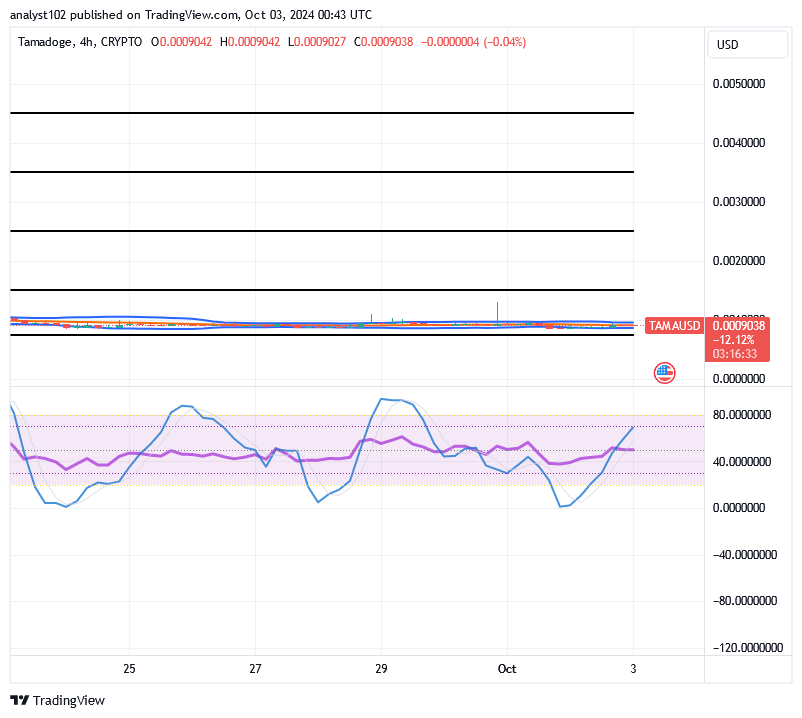
The medium-term TAMA/USD chart shows the crypto-economic price now hovers around $0.001, trying hikes.
The Bollinger Bands are eastward, causing both minor ups and downs at $0.001. There haven’t been any significant gaps between the trend lines to indicate variances. Towards a position close to the line of 80, the stochastic oscillators have been slanting northward.
Is it reasonable to assume that dealers in the TAMA/USD market should hold off while the price stays stable?
The trade places that the developing base instrument has been intended to push is to permit long-term investors to start taking benefits of the crypto against the American Dollar rates at decreased costs, as the Tamacoin trade valuation hangs around $0.001, trying rises.
If the price tends to extend debasing slightly below the $0.001 line, we advise the current stakeholders to add more points to their already-staked positions. On the side of partial compliance of that sentiment, new intending traders may have to commit a reasonable larger part of their funds into this emerging crypto business as it appears to be closely getting to its final low rates ahead of the presumed massive rebounds.
The TAMA/USD short-term
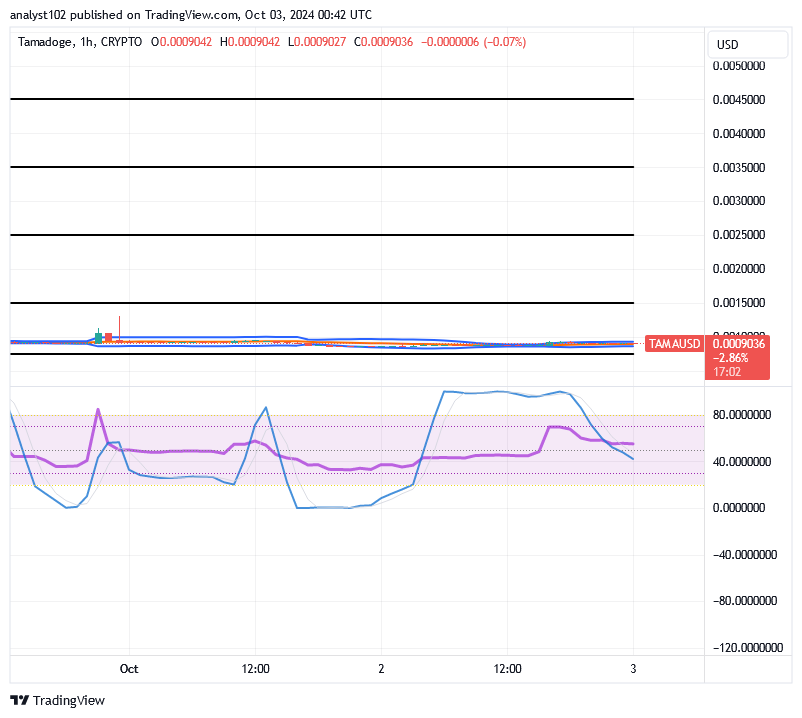
The TAMA/USD short-term chart reveals that the crypto-economic trade is hovering around $0.001 and trying hikes.
Some of the hourly candlesticks that have been present during the past few sessions have lighter-negative indicators, which indicate that bears are generally losing ground at the lower bound of the Bollinger Bands. The stochastic oscillators are seen, traversing southerly to place around 40 in a pattern that looks like signifying that selling forces are vastly approaching an exhaustion stage.
No smartphone runner comes close to #TamadogePursuit.
There’s no mobile runner out there quite like #TamadogePursuit! 🏃♂️
— TAMADOGE (@Tamadogecoin) September 10, 2024
1️⃣ Sign up – start with 20 free credits for a boost!
2️⃣ Climb up the leaderboards.
3️⃣ Win $TAMA rewards!
Play Now! 👇
📱Android: https://t.co/Of8SYALRzL
📱 iOS: https://t.co/IthvqovwAH pic.twitter.com/84HNqob9Rf
Do you want a coin that would 100X in the next few months? That is Tamadoge. Buy TAMA today
Note: Forexschoolonline.com is a financial advisor. Do your research before investing your funds in any financial asset or presented product or event. We are not responsible for your investing results.


Leave a Reply