Tamadoge Price Prediction, December 27
The present financial status of the economic valuation of Tamadoge versus the worth of the American Dollar reveals that the price hovers lowly around the point of $0.00800, getting set for a spike in input.
Many candlesticks have formed, with the main bottom occurring at the $0.00800 threshold. That indicates the value line will be crucial in securing the proper rebound-moving mode in the near future. In order to demonstrate the expected return of the trade myth, long-position placers should, ideally, always adopt position-staking behaviors ahead of the positive cycle.
TAMA/USD Market
Key Levels
Resistance levels: $0.00900, $0.010, $0.011
Support levels:$0.0075, $0.0070, $0.0065
TAMA/USD Medium-term Chart
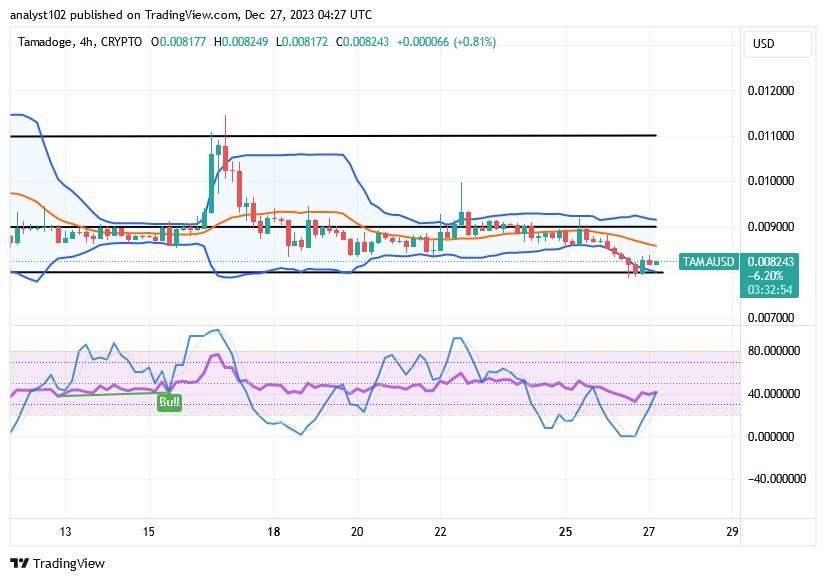
The TAMA/USD medium-term chart reveals that the business economy of the cryptocurrency hovers lowly around the area of $0.00800, getting set for a spike.
The Bollinger Band trend lines have had their lower trend line positioned firmly around the value of $0.00800, indicating that the zone appears not to be an easy-breakthrough spot to the downside. The stochastic oscillators have secured a sizeable length trace in the oversold region before curving back the blue line to the upside to touch the second line around 40. That implies a rallying force is being carried out. 
Should sellers focus more on looking for a going low given that several candlesticks in the TAMA/USD market have been converging at a lower point?
Going further low at a lower strategic trade spot in the transactions that involve Tamadoge against the US coin may potentially lead to losing out on the momentum of a sudden uprising force, given that the cryptocurrency’s price hovers lowly around $0.00800 and is getting set for a spike.
In order to demonstrate that buying orders should continue regardless of how long bears may want to hold back, another round of bargaining has been forming around the lower Bollinger Band trend line. The daily chart’s motion indicates that moves to the south need to stage for a while. Capitalists should take a position in order to gain ground as that sentiment plays out.
TAMA/USD short-term chart
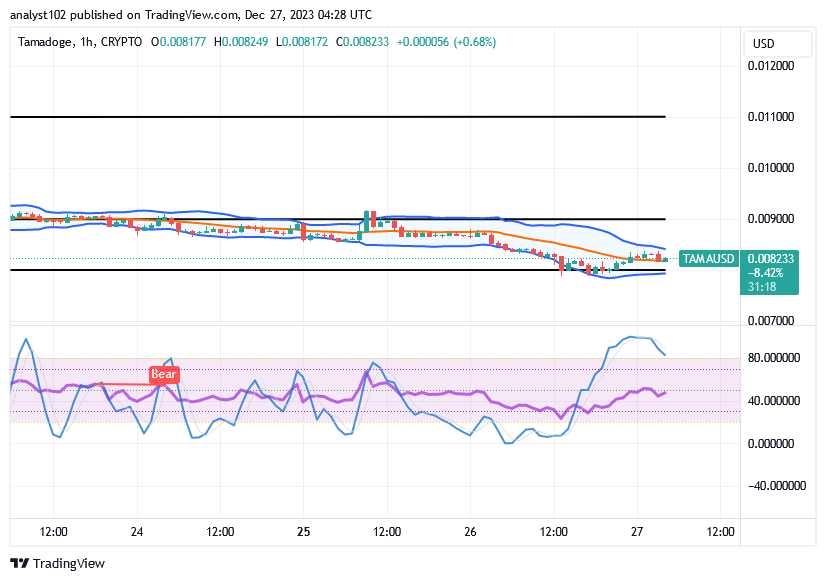
The TAMA/USD short-term chart shows the crypto’s price hovering lowly around $0.00800, getting set for a spike sign.
The trend lines of the Bollinger Bands have managed to move momentarily southward, between $0.00900 and $0.00800. The stochastic oscillators are trending southward and have crossed into the overbought area. While the blue line of the Oscillatos points tentatively down, suggesting that sell-offs might not feature steadily in the market for long, buyers might be returning to a favorable repositioning situation.
Play five thrilling games, accumulate points, and get your $TAMA rewards. Download right now.
The Tamadoge Arcade is calling 🕹
— TAMADOGE (@Tamadogecoin) December 26, 2023
Play 5 exciting games, rack up those points, and claim your $TAMA prizes. Download now
📱 Android: https://t.co/OUHxpNLRFT
📱 iOS: https://t.co/BCCdGKHiYw pic.twitter.com/oxbkkg7AlQ
Do you want a coin that would 100X in the next few months? That is Tamadoge. Buy TAMA today
Note:Forexschoolonline.com is not a financial advisor. Do your research before investing your funds in any financial asset or presented product or event. We are not responsible for your investing results.


Leave a Reply