Tamadoge Price Prediction – September 11
Another momentary trade has taken place in the business ties involving Tamadoge and the US currency as the crypto-economic price hovers at $0.01100, suggesting a bounce running into some hours ago.
Given that the price tends to temporarily fall into a recession before moving in a clear direction, it would be technically idealistic to exhibit some patience when executing a trade at this time. However, in the coming days, buying positions are expected to eclipse all other trade trends. In this developing cryptocurrency economy, reversing an upward trend will never again result in respectable long-term entry orders.
TAMA/USD Market
Key Levels
Resistance levels: $0.01200, $0.01250, $0.01300
Support levels: $0.01000, $0.009500, $0.009000
TAMA/USD Medium-term Chart
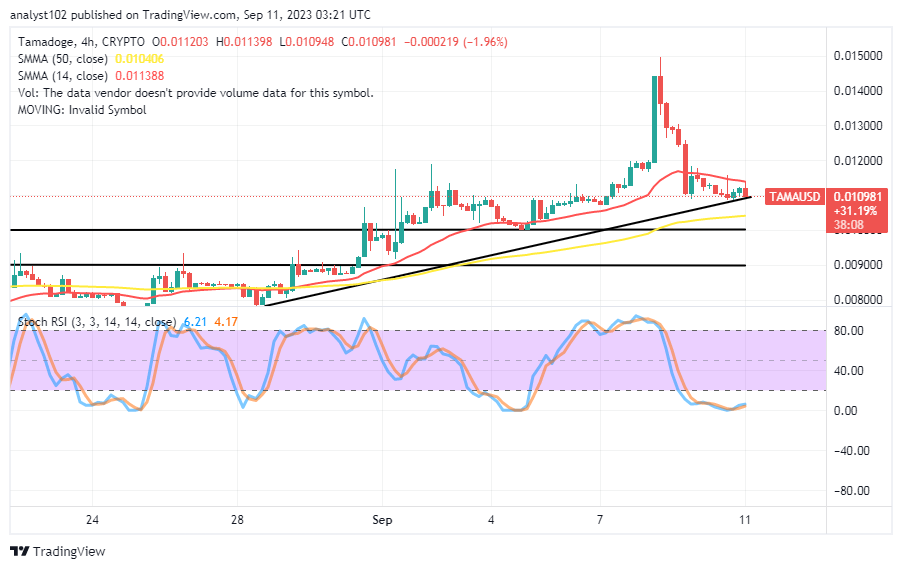
The TAMA/USD medium-term chart reveals that the crypto-economic price hovers at $0.01100, suggesting a bounce around the trend lines of the moving averages.
The 14-day SMA indicator is positioned northwardly at $0.011388 above the $0.010406 point of the 50-day SMA indicator. The lower horizontal line is at $0.01000, and it is supported by a lower point of $0.009000. The stochastic oscillators are dipped into the oversold region, positioning from 4.17 to 6.21 values. That signifies a rise in the piling process.
Will the TAMA/USD market’s bears attempt to force further down through crucial supports starting around $0.01000 and below them later?
A long-attaining loss of momentum in the weight of the TAMA/USD market bulls could easily lead to giving in to further free fall-offs through the support line of $0.01000 and beyond, given that the crypto-economic price hovers at $0.01100 presently, suggesting a bounce.
In the sessions that follow, candlestick formation may resume in a sideways range to border at $0.01100, with likely unsuccessful attempts toward the support of $0.01000. Long-position takers should not hesitate to enter the market as that feeling develops. Investors should, above all, note that the prices of cryptocurrency business deals are still depreciating.
TAMA/USD Short-term chart
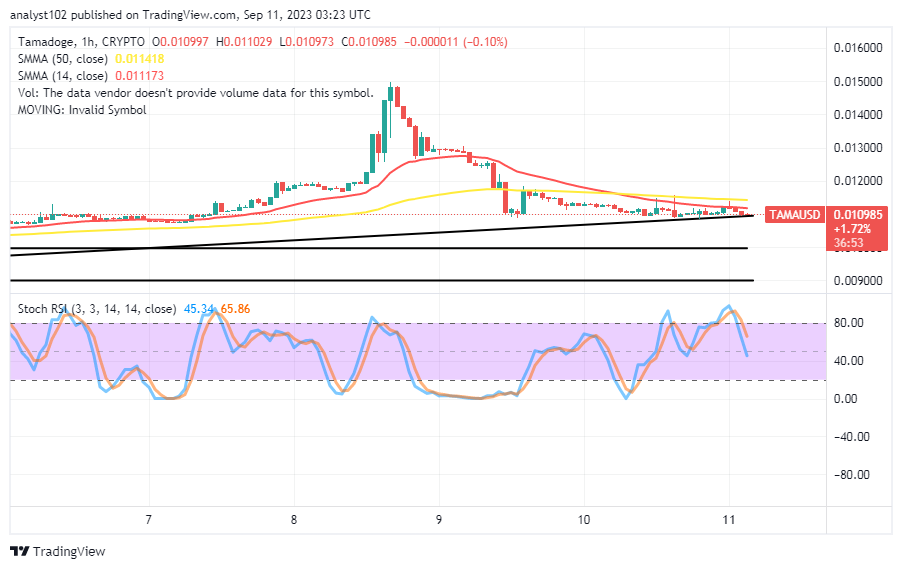
The TAMA/USD short-term chart showcases that the crypto-economic price hovers at $0.01100, suggesting a bounce above the bullish trend line drawn tightly beneath the trend lines of the moving averages.
Given that resistance at $0.01200 remains tough to breach to open the way for solid ups, the 14-day SMA indicator is closely below the 50-day SMA indicator. This suggests that a line of retracements must continue. The stochastic oscillators have moved from the overbought area in a southerly direction to obtain values between 65.86 and 45.34. Before staging a buy position order, take a complementary reading position between the 4-hour and 1-hour time frames to signal an upward resumption.
To participate in the weekly $TAMA (https://twitter.com/search?q=%24TAMA&src=cashtag_click) prize draw, visit Tamadoge Arena.
Game faces on 😤
— TAMADOGE (@Tamadogecoin) September 10, 2023
Hit up Tamadoge Arena to earn your share of the weekly $TAMA prize pool 💰
Download on mobile now 👇
📱 Android: https://t.co/INCaGendE4
📱 iOS: https://t.co/Fj9tT5Oicu pic.twitter.com/VSa0cZxT0m
Do you want a coin that would 100X in the next few months? That is Tamadoge. Buy TAMA today
Note:Forexschoolonline.com is not a financial advisor. Do your research before investing your funds in any financial asset or presented product or event. We are not responsible for your investing results.


Leave a Reply