Tamadoge Price Prediction – September 7
Even though a less predominant trade situation has been experienced in the market operations involving Tamadoge and the US coin, the crypto’s price has held above the resistance line of $0.01200 over time, keeping bulls safe above some underlying support values.
Since much energy has been expended as of the writing of this technical article, it is possible that a pit stop session at a higher trade spot will occur soon. While that prediction is generally true, if the market produces a false surge in the direction of or near the resistance level of $0.01200, a retracement process may resume. On the downside, purchasers should be confident that their positions will eventually push them over the point in the long run.
TAMA/USD Market
Key Levels
Resistance levels: $0.01200, $0.01250, $0.01300
Support levels: $0.01000, $0.009500, $0.009000
TAMA/USD Medium-term Chart
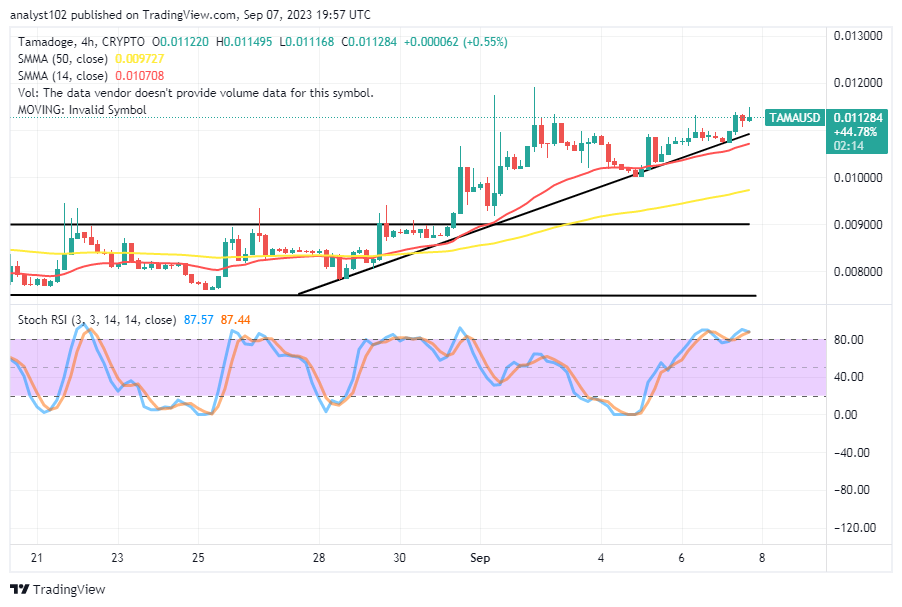
The TAMA/USD medium-term chart reveals that the crypto-economic price holds up, keeping bulls safe above the trend lines of the SMAs.
The indicators are still going upward after holding a bullish posture, with the 14-day SMA positioned at $0.010708 above the $0.009727 value of the 50-day SMA. The stochastic oscillators are overbought, with values ranging from 87.44 to 87.57.
What kind of trading mindset would be necessary for bulls to continue pushing past resistances in the long run from where they are now?
A restless consolidation moving mood has to be put by the Tamadoge market against the US Dollar to validate the probability of witnessing further positive values as the crypto-economic price rises underneath the barrier-trading spot of $0.01200, keeping bulls safe.
Given that the stochastic oscillators are set up to read an overbought state at this time, long-position placers are less likely to push aggressively. The greatest moment to maintain perfect posture and reduce the likelihood of free falls is still now, though. In other words, the introduction of a commitment to capital volume is still possible.
TAMA/USD Short-term chart
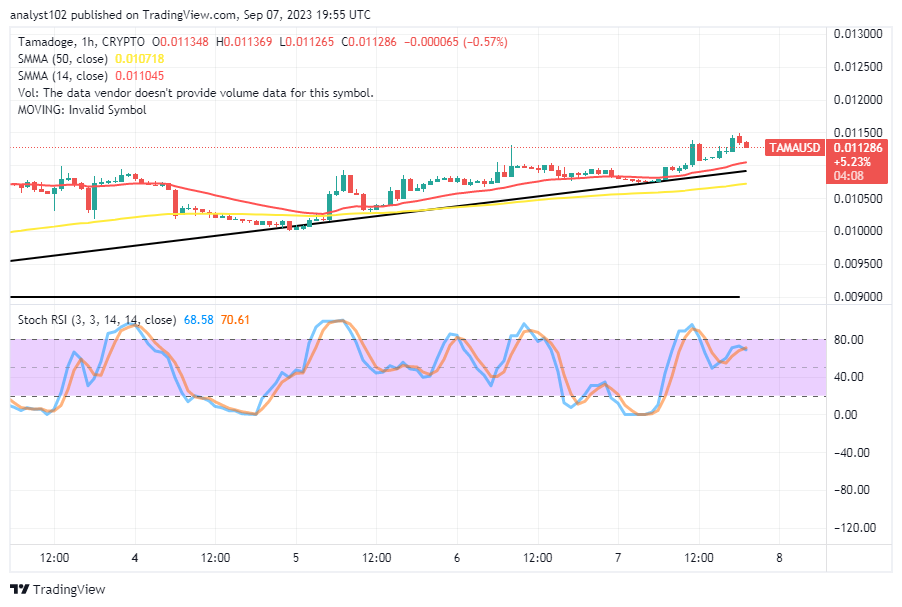
The TAMA/USD short-term chart reveals that the crypto’s price holds above the smaller moving average trend line, keeping bulls safe.
The 50-day SMA indicator’s value line of $0.010718 is $0.011045 above the 14-day SMA indicator’s value line. The Stochastic Oscillators’ depiction of this at higher levels shows an unstable upward-swinging motion. That demonstrates that it is not always easy for sellers to deal with depression.
Earn a portion of this week’s $TAMA (https://twitter.com/search?q=%24TAMA&src=cashtag_click) reward pool by laying down right away.
👏 A round of applause for our Top 5 Tamadoge Arena players this week 👏
— TAMADOGE (@Tamadogecoin) September 7, 2023
Play now and earn your share of this weeks $TAMA prize pool 👇
📱 Android: https://t.co/INCaGendE4
📱 iOS: https://t.co/Fj9tT5Oicu pic.twitter.com/91OdO6GR9A
Do you want a coin that would 100X in the next few months? That is Tamadoge. Buy TAMA today
Note:Forexschoolonline.com is not a financial advisor. Do your research before investing your funds in any financial asset or presented product or event. We are not responsible for your investing results.


Leave a Reply