Tamadoge Price Prediction, December 14
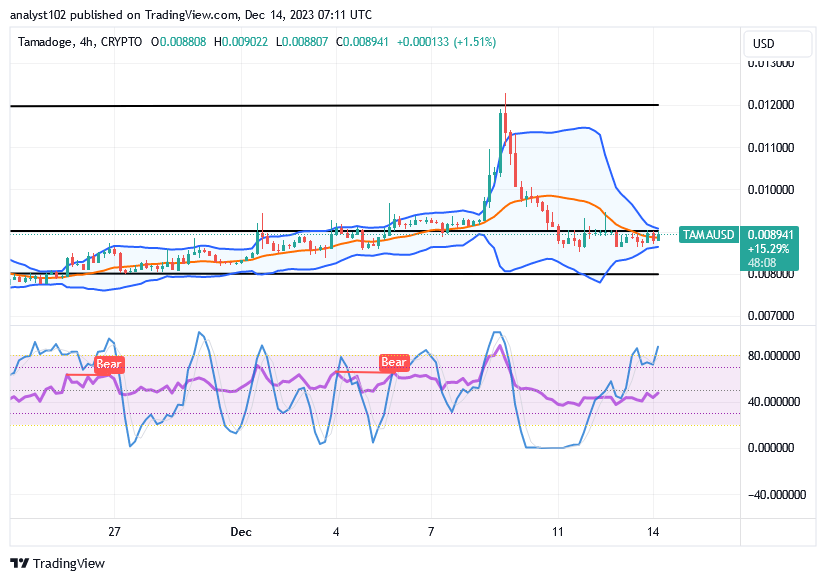
An exhaustion of velocity on the path of the market’s forces to the downside has materialized in the market operation of Tamadoge versus the valuation of the US Dollar, given that the crypto-economic price holds lows, composing hikes.
The trend lines of the Bollinger Bands are near the $0.00900 negotiating line, suggesting that price action will probably occur in a horizontal fashion. Should that assumption prove to be accurate a substantial portion of the time, purchasers will most likely go through a recessionary phase that may culminate in an abrupt upswing.
TAMA/USD Market
Key Levels
Resistance levels: $0.010, $0.011, $0.012
Support levels:$0.00800, $0.0075, $0.0070
TAMA/USD Medium-term Chart
The TAMA/USD medium-term chart showcases the crypto market holding lows between a smaller space of the Bollinger Bands, composing hikes.
To indicate that purchasing power is running low in the north, the stochastic oscillators have been swapped out. The Bollinger Band indicators are set up to determine whether or not buyers are attempting to center their positions around the lower Bollinger Band’s value.
Is there a chance of a bounce back from the lower bound of the Bollinger Band for sellers of the TAMA/USD trades?
The gravitational force that has been inflicted on the market to give birth to a retracement won’t probably gain more stances beyond the support of $0.00800, as the TAMA/USD market holds lows, composing hikes.
Despite the tendency for the situation to continue in ranges, the positional posture of the stochastic oscillators is demonstrating that the price is preventing a swing up. It is recommended that additional positions be accumulated. Even with the formation of an active downward pressure, the execution of instant shorting orders at this moment may result in needless whipsawed conditions.
TAMA/USD short-term chart
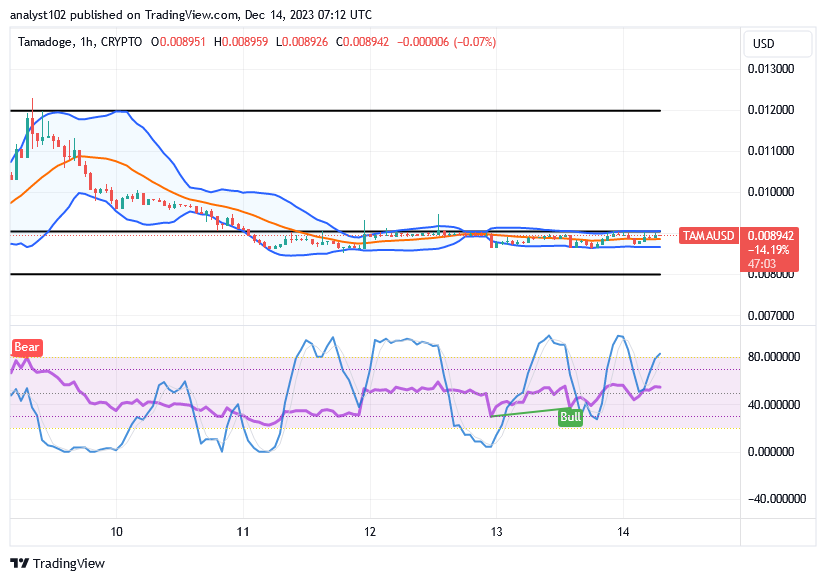
The TAMA/USD short-term chart showcases the crypto trade holding lows, composing a hike signal in the Bollinger Band trend lines.
Around the $0.00900 mark, the Bollinger Band indicators have been trending closely southerly. Candlestick patterns have been characterized by lower lows. Resuming a rallying motion is also possible if the formation features a lot of lower highs. The stochastic oscillators are erratically leaning to the north, suggesting that purchasing activity is about to take a position in the upcoming operations.
In the Tamadoge Arena, the phrase “survival of the fittest” has a whole new meaning!
🐾 Survival of the fittest takes on a whole new meaning in the Tamadoge Arena!
— TAMADOGE (@Tamadogecoin) December 11, 2023
Fight to survive and earn your $TAMA rewards 💰
Download Now 👇
📱 Android: https://t.co/INCaGenLtC
📱 iOS: https://t.co/Fj9tT5OQ22 pic.twitter.com/cvZ1lpdEV1
Do you want a coin that would 100X in the next few months? That is Tamadoge. Buy TAMA today
Note:Forexschoolonline.com is not a financial advisor. Do your research before investing your funds in any financial asset or presented product or event. We are not responsible for your investing results.


Leave a Reply