Tamadoge Price Prediction – September 3
Buyers presently appear making a degree of positive price responses against sellers in the operation of the TAMA/USD market, as the crypto-economic price now holds bounces, facing resistances.
A slight shift in the trend lines of the Bollinger Bands to the upside has set to make the pathways that the trade will potentially follow back to the increasing side. According to these statistics, long-position movers have been moving closer to the $0.002 barrier while bucking some of the market’s negative indications. The recovering process may take longer than anticipated ahead the long-expected large returns.
Key Levels
Resistance levels: $0.002, $0.003, $0.004
Support levels: $0.00075, $0.0005, $0.00025
TAMA/USD Medium-term Chart
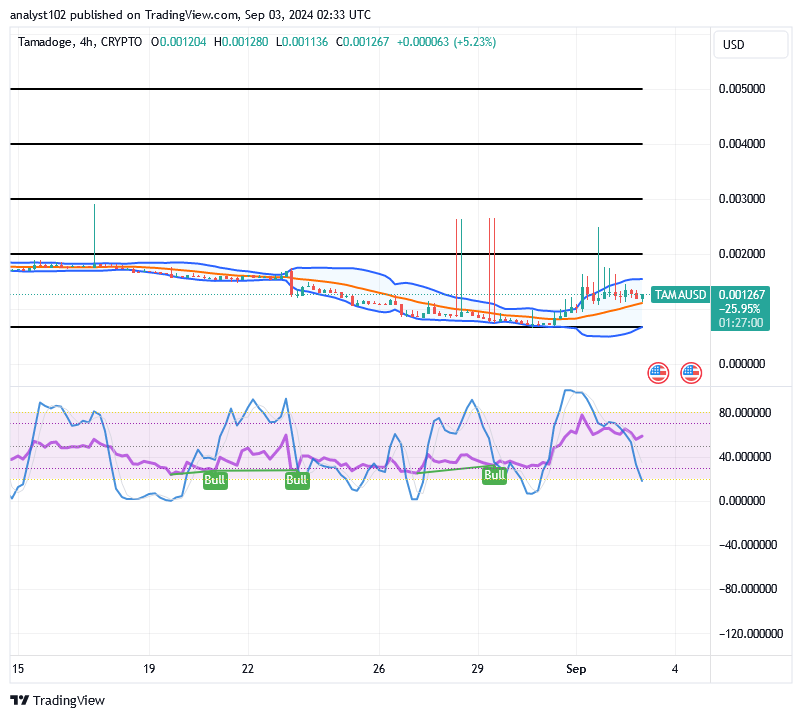
The medium-term TAMA/USD chart reveals the crypto-economic price currently holds bounces inputs, facing resistances around $0.002.
Hope is growing that a stable bullish candlestick will develop, which would result in the construction of a wall in subsequent swings back upward, since there have been many erratic spiking signals on the majority of the medium-term based candlestick formations over the course of a few sessions. The Bollinger Bands are now trying to reshape to the north, coming to face the resistances of $0.002 line. The stochastic oscillators descend in search of a means to curve back upward soon.
Which side of the Bollinger Bands indicators for the TAMA/USD market should act as the crucial support line right now?
Looking at the attempt of the Bollinger Bands tending to get repositioned back to the upside, the trade zones portended by the lower part appear now as the crucial underlying support zones, given that the TAMA/USD trade currently holds bounce signals, facing resistances around $0.002.
Since the way the price is currently moving has undergone some positive changes, long-position pushers can breathe a sigh of relief knowing that there is a chance to maintain their aggressive recovery of the cryptocurrency’s valuation when compared to the US dollar.
The TAMA/USD short-term
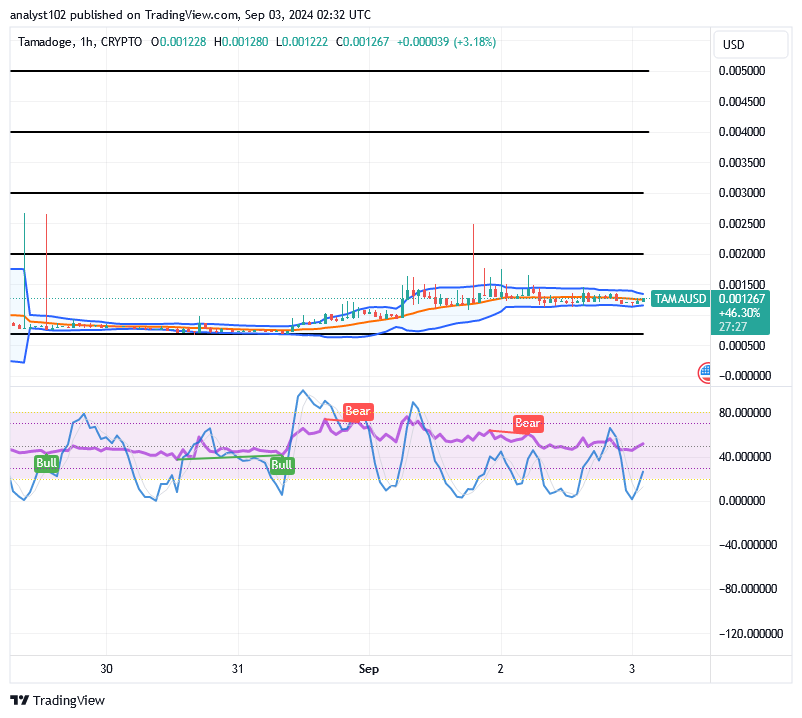
The TAMA/USD short-term chart shows the crypto-economic price now holds bounce signals, facing resistances around $0.002.
The hourly calmness of the candlesticks indicates that the price reactions have caused the Bollinger Bands to shift to the upward and hold positions at the $0.0015 value line. Indicating that caution may be used against obtaining a better price for purchasing an order in the meantime, the stochastic oscillators have recently appeared to be shifting their positions and forming many bearish indications. However, given the lower values the crypto economy is now maintaining, long-term investors do not need to share that opinion.
Gain your TAMA awards by moving up the levels.
Remember that as your score rises, so does your share!
Calling all #Tamadoge enthusiasts! 🚨
— TAMADOGE (@Tamadogecoin) August 14, 2024
The Leaderboards are closing at Midnight UTC! 🕛
Battle up the ranks and claim your $TAMA rewards. ✅
Remember, the higher you score, the bigger your share!💰#PlayToEarn #CryptoGaming #P2E pic.twitter.com/mtBfKghgsR
Do you want a coin that would 100X in the next few months? That is Tamadoge. Buy TAMA today
Note: Forexschoolonline.com is a financial advisor. Do your research before investing your funds in any financial asset or presented product or event. We are not responsible for your investing results.


Leave a Reply