Tamadoge Price Prediction – July 30
Buying opinions in the TAMA/USD market operations have come to affirm that the crypto-economic price holds firmly on the line of $0.0100, attempting ups at times.
Bulls will make easy pushes via the variation upward pushes that turned in the direction of the southward reversal motion while the bullish-trading cycle eventually verifies itself in the months to come. These upward pushes have also amassed certain degrees of positive promissory indicators. Long-term investors can still play along in the meantime, though, since there are still some window opportunities for launching lengthy position orders.
TAMA/USD Market
Key Levels
Resistance levels: $0.01100, $0.01150, $0.01200
Support levels: $0.00950, $0.00900, $0.00850
TAMA/USD Medium-term Chart
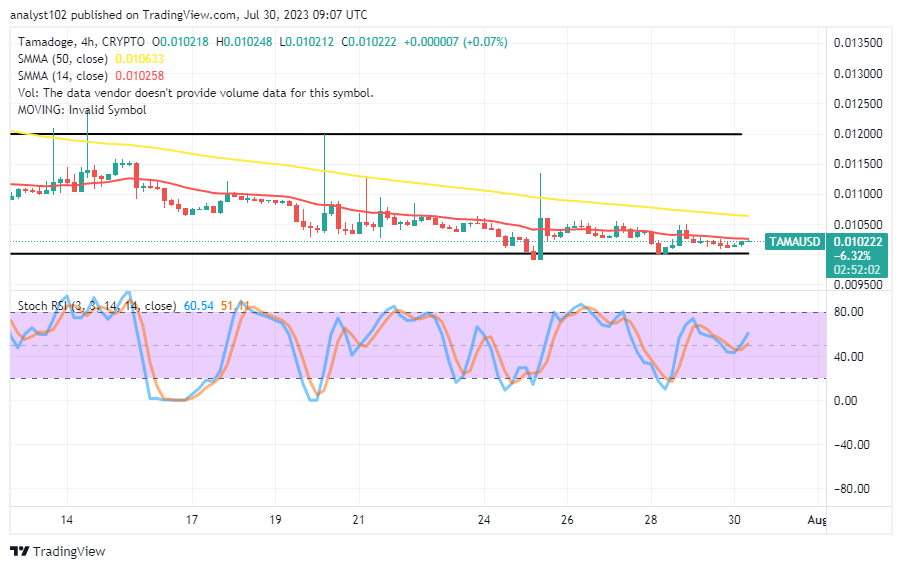
The TAMA/USD medium-term chart reveals that the crypto-economic price holds firm on the $0.0100 trade line, attempting ups most of the time.
The trend path that has been formed along the formation of candlesticks shows that the market remains bent toward finding supports beneath the smaller indicator. The 14-day trend line is $0.010258 below the $0.010633 value of the 50-day SMA trend line. The Stochastic Oscillators have been able to cross back northbound from around the points of 40 to 51.11 and 60.54.
Will it be advantageous for the TAMA/USD’s smaller SMA to position or break through the $0.0100 support point over the long term?
It will be a condition for the TAMA/USD market operation to extend into lower range-bound spots of between $0.0100 and $0.00950 if the 14-day SMA eventually touches the point to the downside, given that the crypto-economic holds firm on the point in question, attempting ups.
Investors must maintain their positions by refusing to dance to any falling force, regardless of how long the transaction is expected to continue. It is common to see such moments traded for greater ones that will soar in no time. Additionally, joining the movements that are often moving at a northward pace may be a little late. If that p resumption must exist, traders might think about purchasing the dips before any potential bounce-offs.
TAMA/USD Short-term chart
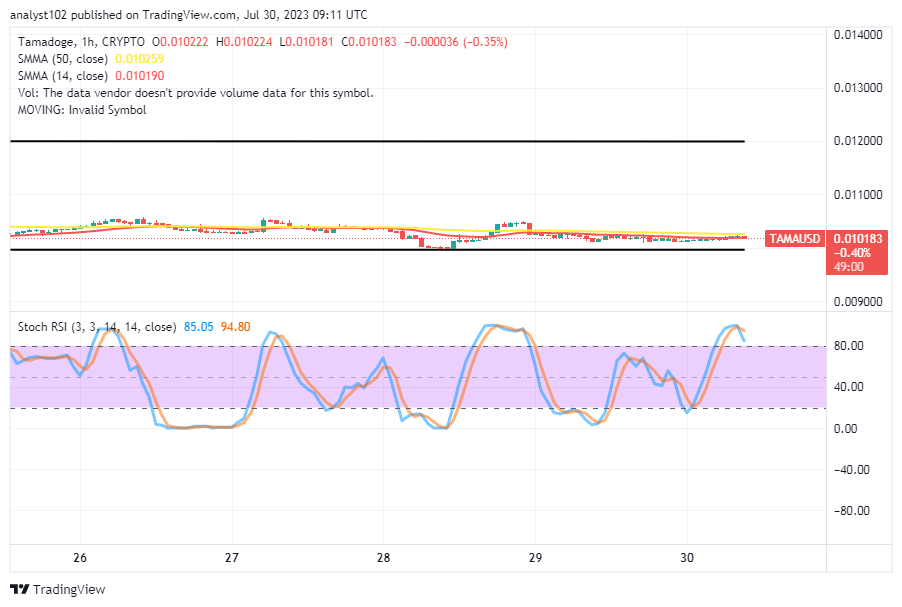
The TAMA/USD short-term chart reveals the crypto market holds firm on $0.0100, attempting ups over time.
As the indications have been, a lot of attention is being drawn to the point of $0.0100. The 50-day SMA trend line and the 14-day SMA trend line are connected and are moving near the point in an easterly direction. In order to indicate that some degree of downward thinking may still play out for a brief period of time, the stochastic oscillators have crossed slightly southerly from the oversold zone to remain between 94.80 and 85.05 values. However, it doesn’t seem feasible for sellers to follow because the force is probably going to remain weak until the oscillators are repositioned to cancel out the current posture sign
Get all the updates and more from our community manager, Tama Tom, who has some exciting news concerning our app store submission!
🗞️ Weekly Tamadoge Update 🗞️
— TAMADOGE (@Tamadogecoin) July 28, 2023
Community Manager, Tama Tom, has some exciting news about our app store submission 🤩 get all the updates and more!
Get your fix now ▶️ pic.twitter.com/yEVvErd7Dt
Do you want a coin that would 100X in the next few months? That is Tamadoge. Buy TAMA today
Note: Forexschoolonline.com is not a financial advisor. Do your research before investing your funds in any financial asset or presented product or event. We are not responsible for your investing results.


Leave a Reply