Tamadoge Price Prediction, March 23
Some depression forces have been continually playing out in the market operation between Tamadoge and the American currency, as the crypto market has spiraling signs and contriving bases.
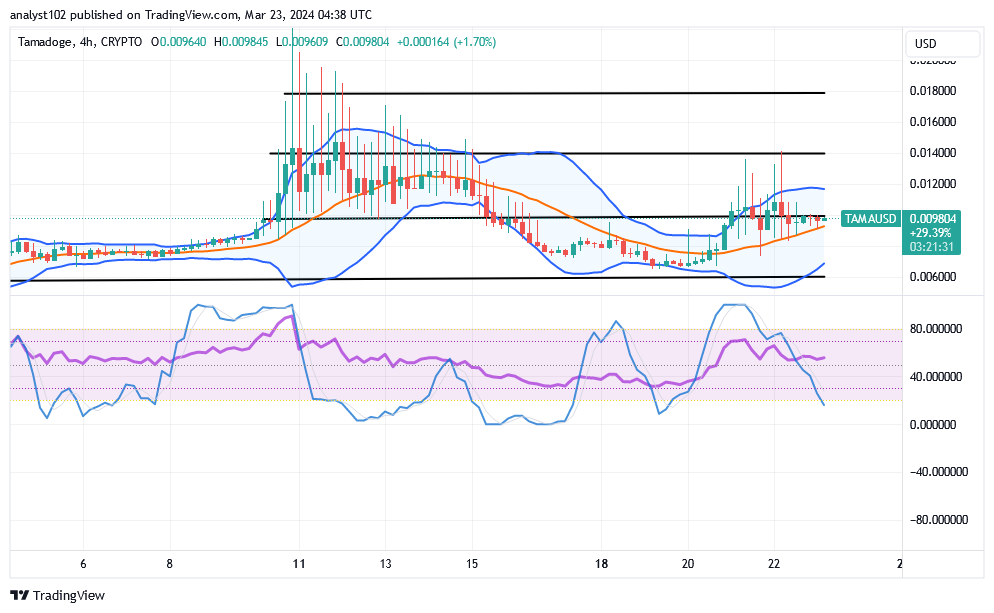
It has been closely observed that underlying supports have been seen building up at close ranges above the point of $0.0065. The trade region of $0.006, as shown by the lower Bollinger Band trend line, may be reached if the market tends to still give in to a tentative series of corrections. It is anticipated that buyers will have to maintain their holdings based on their long-term running style.
TAMA/USD Market
Key Levels
Resistance levels: $0.014, $0.016, $0.018
Support levels: $0.0065, $0.0055, $0.0045
TAMA/USD Medium-term Chart
The TAMA/USD short-term chart reveals that the crypto-economic price has spiraling signs, corroding bases.
The Bollinger Band trend lines are in the manner of managing to get repositioning styles in the north direction by producing vital systemic values around the resistance line of $0.012 and at the lesser trade side of $0.006. The stochastic oscillators have been significantly reshaped into the oversold region.
Should sellers focus on the assumed decrease if a bearish candlestick finally forms across the middle and lower Bollinger Bands?
Any probable falling force that could lead to the emergence of a bearish candlestick against the points of middle and lower Bollinger Band indicators—such a situation will give ways to getting decent dip buys, given that the TAMA/USD market has spiral signs and contriving bases.
When choosing a stochastic oscillator’s optimal technical trending view, the forces that brighten further southward moves have been progressively waning. Therefore, in order to turn a profit, each good upsurge that emerges will force succeeding advances to overcome overhead obstacles.
TAMA/USD short-term chart
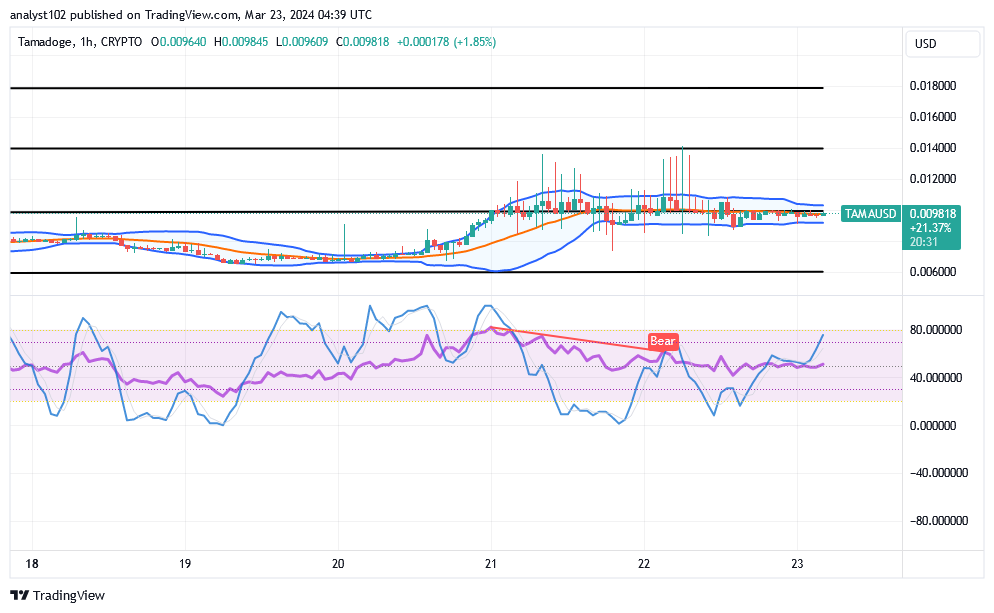
The TAMA/USD short-term chart showcases that the crypto market has spiral signs and contriving bases.
Following that, the Bollinger Band trend lines have been observed extending around the values of $0.010 and $0.009, confirming the presence of a line of price ranges. In order to indicate that buying orders are inclined to take a stronger posture against the vulnerabilities of bears, the stochastic oscillators have been attempting to veer northward across certain ranges.
Explore the world of Tamadoge games to see how much money you can make with TAMA!
Dive into the world of Tamadoge games and watch your $TAMA earnings grow!
— TAMADOGE (@Tamadogecoin) January 16, 2024
Play, earn, stake, and repeat for an endless cycle of excitement and rewards 🎉
Check out all of our games on mobile now 👇
📱 Android: https://t.co/D4TjX7gTFl
📱 iOS: https://t.co/0fjJapf5oA pic.twitter.com/7QrRJ2V98s
Do you want a coin that would 100X in the next few months? That is Tamadoge. Buy TAMA today
Note: Forexschoolonline.com is not a financial advisor. Do your research before investing your funds in any financial asset or presented product or event. We are not responsible for your investing results.


Leave a Reply