Tamadoge Price Prediction, December 12
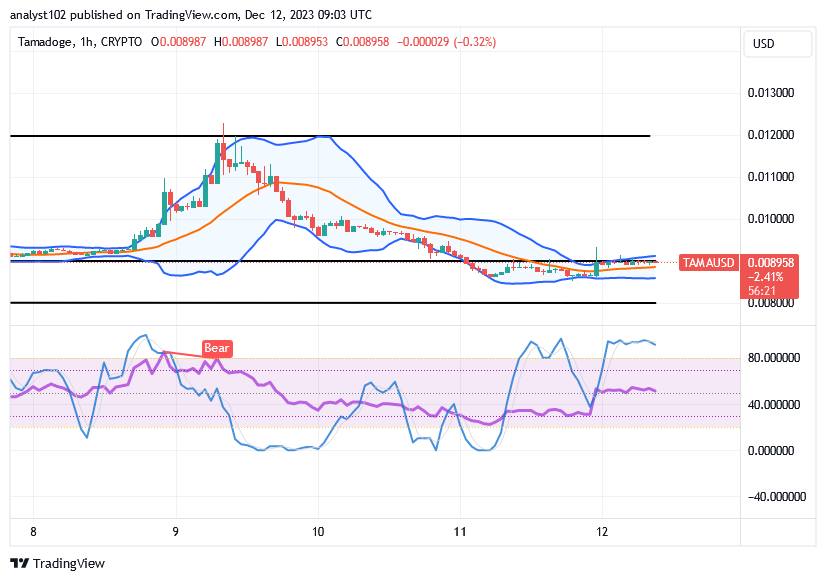
A series of falling movements that have occurred in the valuation of the TAMA/USD market has led the crypto economy to trade around $0.008965, as the crypto is rebuilding a spike index in the area of formidable lower-trading zones.
The lower Bollinger Band trend line is positioned around the $0.00800 support trade point, indicating the critical and important trade point where bulls may ease up before regaining power to push higher in the upcoming northward volatility moves. Since there have been several significant ups and downs in price, traders should always follow the critical resistance and support points inside the Bollinger Bands. But in the upcoming months, investors will profit to the fullest extent possible.
TAMA/USD Market
Key Levels
Resistance levels: $0.010, $0.01050, $0.01100
Support levels:$0.00800, $0.0075, $0.00700
TAMA/USD Medium-term Chart
The TAMA/USD medium-term chart reveals the crypto-economic market goes under, rebuilding a spike index between the zones of the middle and the lower Bollinger Band trend lines.
The Bollinger Band trend lines are currently wide open, principally around the values of $0.012 and $0.00800. The stochastic oscillators have traversed southbound into the oversold before the blue line makes an attempt to join back its second part around the 40. A line of bullish candlesticks has been gradually forming in smaller quantities.
Given that the price of the TAMA/USD market is situated between the middle and lower Bollinger Bands, should we anticipate more declines?
Expectation from the technical angle does not support the probability of getting to see more reliable push-offs in the TAMA/USD market as the crypto-economic price goes under, rebuilding a spike index.
Given that the stochastic oscillators are in the mood to reposition themselves back to the upward, a rebasing trade has been occurring. The market appears to maintain momentum above the lower Bollinger Band indicator’s value line, indicating that long-position placers should stick with their purchases rather than pursue shorting position orders.
TAMA/USD short-term chart
The TAMA/USD short-term chart reveals the crypto market goes under, rebuilding a spike index in the trade arena of the Bollinger Bands.
The stochastic oscillators indicate that sales may soon come to an end because they are in an overbought area and still have some pushing forces. The Bollinger Band indicators are closely displayed around the logical line of $0.00900. We advise purchasers to advance to the north side in full force.
There’s lots of ways to earn in the Tamaverse!
There’s lots of ways to earn in the Tamaverse!
— TAMADOGE (@Tamadogecoin) December 12, 2023
Check out all our apps Arcade, Arena and Tamadogi on mobile 👇
📱 Android: https://t.co/D4TjX7gTFl
📱 iOS: https://t.co/0fjJapf5oA pic.twitter.com/akWxi2BV2q
Do you want a coin that would 100X in the next few months? That is Tamadoge. Buy TAMA today
Note:Forexschoolonline.com is not a financial advisor. Do your research before investing your funds in any financial asset or presented product or event. We are not responsible for your investing results.


Leave a Reply